
Figure 7. Region specific phenotypes of BG microglia emerge during the second postnatal week.
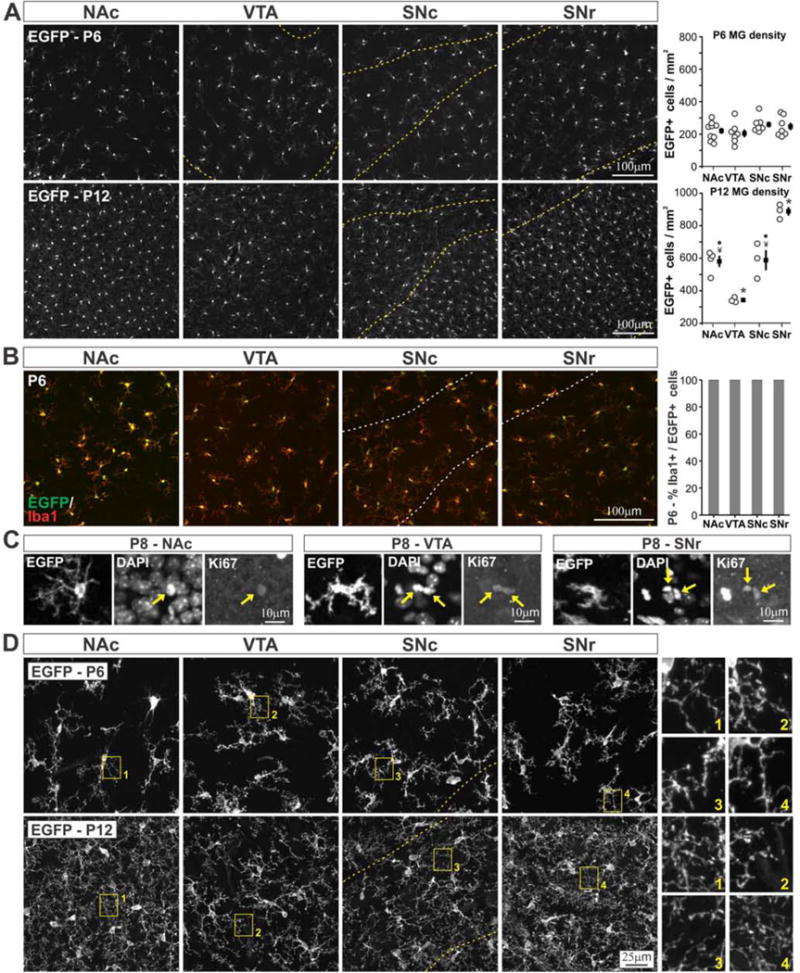
A – Distribution and density of BG microglia at postnatal day 6 (P6) (top, ANOVA F(3,26) = 1.3, P = 0.29, n.s., N = 7–9 mice per region) and P12 (bottom, ANOVA F(3,9) = 31.8, P = 0.00005, N = 3–4 mice per region). Yellow dashed lines indicate boundaries of VTA, SNc, and SNr. ● P < 0.02 vs. VTA, ¥ P < 0.02 vs. SNr, * P < 0.02 all individual comparisons. B – Visualization and quantification of overlap in EGFP and Iba1 expression in P6 BG microglia. White dashed lines indicate boundaries of SNc and SNr. C – Example Ki67+ microglia in NAc, VTA, and SNr of P8 CX3CR1EGFP/+ mice. Yellow arrows indicate DAPI+Ki67+ nuclei corresponding to highlighted EGFP+ microglia. D – High magnification images of BG microglial branching structure in P6 (top) and P12 (bottom) CX3CR1EGFP/+ mice. Yellow boxes highlight regions shown enlarged at right. Dashed yellow lines indicate SNc boundary.