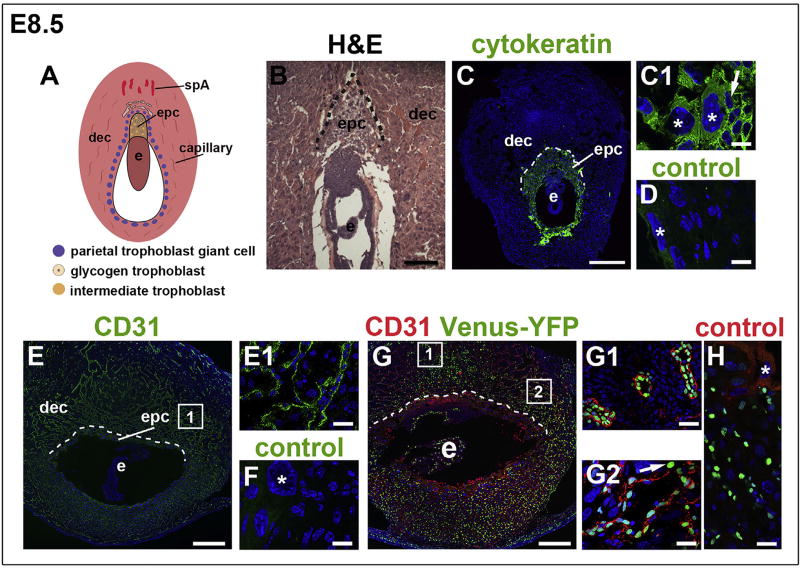
Fig. 1. Notch activity in the decidua at E8.5.
The orientation is the same for all panels; mesometrial at the top and anti-mesometrial at the bottom. (A) Schematic representation of an E8.5 implantation site, highlighting the decidua, maternal blood supply and TB subtypes. (B) H&E highlighting the decidua, EPC and embryo. (C–H) IF was performed on tissue sections and nuclei were stained with DAPI (blue). The dotted line shows the border between the decidua and P-TGC layer. (C) Pan-trophoblast marker, cytokeratin identifies TBs, including P-TGCs (C1, asterisks) and EPC TBs (C1, arrow). (D) Negative control stained with the anti-rabbit secondary used for panels C, C1. Asterisks mark P-TGCs. (E, E1) CD31 identifies ECs of decidual vessels. (F) Negative control stained with the anti-rat secondary used for panels E, E1. Asterisk marks a P-TGC. (G) IF of sections through implantation sites of female CBF:H2B-Venus Notch reporter mice enabled assessment of Notch activity in the decidua. Notch activity (green) was observed in CD31+ ECs (red) of spiral arteries (G1) and decidual capillaries (G2). Notch activity was also observed in non-vascular, decidual cells (G2, arrow). (H) Negative control for the CBF:H2B-Venus Notch reporter stained with the anti-rat secondary used for panels G, G1 and G2. Asterisk marks a P-TGC without Venus-YFP expression. The squares in E and G show the general regions from which the higher magnification areas visualized in E1, G1, and G2 are derived. Dec, decidua; e, embryo; epc, ectoplacental cone; spA, spiral artery. Scale bars B, E, and G = 100 µm. Scale bar C = 500 µm. Scale bars C1, D, E1, F, G1, G2 and H = 25 µm.

