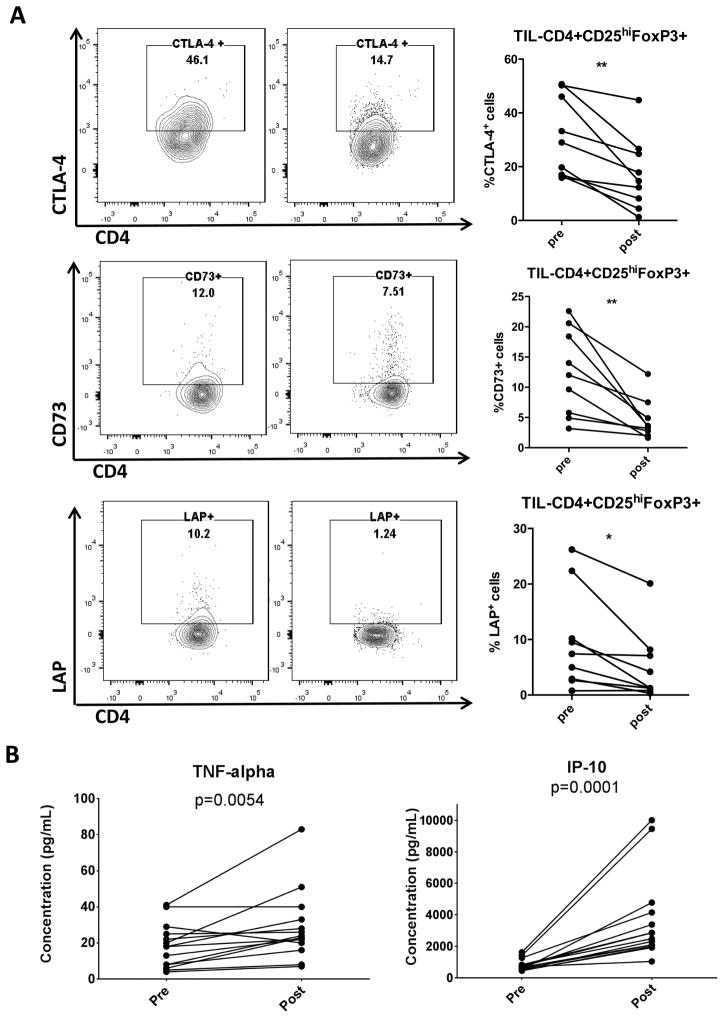
Figure 4.
(A) Clinical trial patient TIL were collected pre- and post-treatment regimen and analyzed for suppressive markers using flow cytometry. Representative flow plots and summary data of percentage of CTLA-4, CD73 and LAP on CD4+CD25hiFoxp3+ Treg are shown (n=9). (B) Luminex analysis of clinical trial patient plasma specimens was performed in duplicate using a MILLIPLEX MAP 29-plex human cytokine/chemokine bead panel. Data show plasma concentrations of TNFα and IP-10 (n=14). Significance was calculated with paired t test, *p<0.05; **p<0.01.

