
Figure 3. Timing of SO-spindle interactions predicts memory retention.
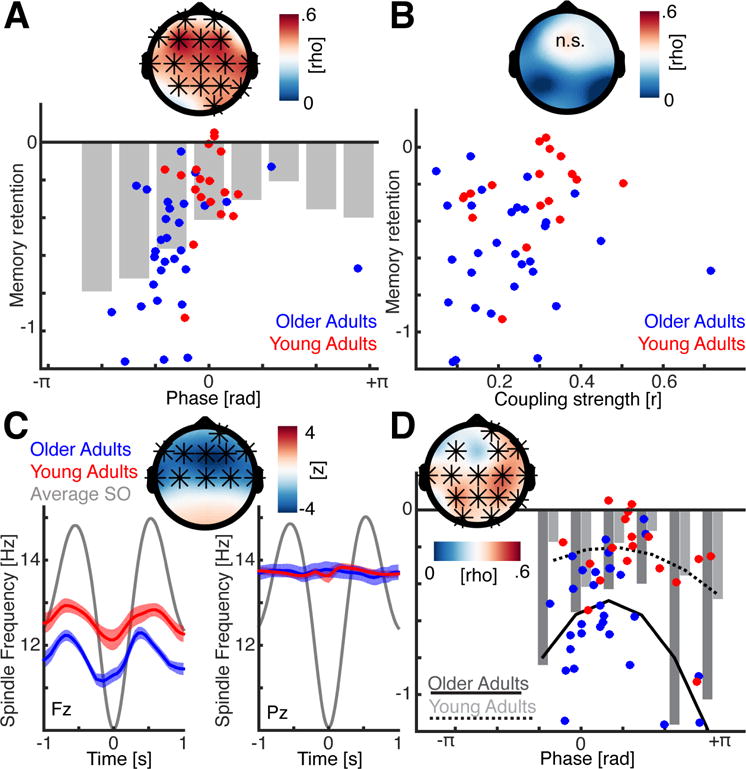
(a) Upper: Cluster-corrected circular-linear correlation analysis between the individual mean SO-spindle coupling phase and overnight memory retention after correction for power differences (* indicates significant sensors). The strongest effect was observed at electrode F3. Lower: Blue dots indicate older adults; red dots young adults. We binned the mean behavioral performance relative to the coupling phase in 10 overlapping bins to highlight the u-shaped, non-linear relationship. (b) No significant correlation was observed between coupling strength (resultant vector length) and memory retention (same conventions as in panel A). (c) Sleep spindle frequency relative to SO cycle at a frontal (left) and parieto-occipital (Pz; right) electrode (mean ± SEM). Frontal sleep spindles are slower than posterior sleep spindles. Their frequency only varies as a function of the SO phase over frontal regions where it is significantly lower for older adults (top panel). (d) Cluster-corrected circular-linear correlations after correcting for differences in power distributions and sleep spindle frequencies (see also Figure S3; same conventions as in panel A). Importantly, memory retention was coupling phase dependent in older and young adults. Overall the best performance was observed when the sleep spindles peak just after the SO peak. Blue dots depict older adults. Dark grey bars indicate mean binned memory performance; black solid line depicts a quadratic fit to approximate the non-linear u-shaped relationship. Conversely, red dots, light grey bars and the dashed black line reflect young adults.