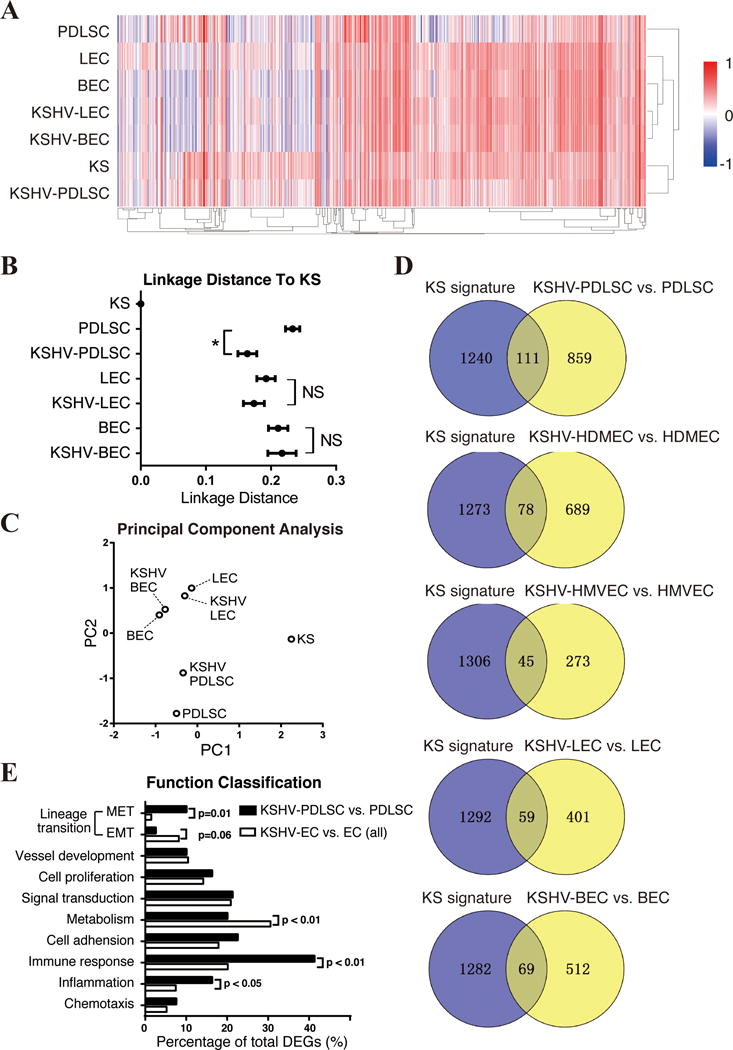
Fig. 6. Relationship of KSHV-infected MSCs and endothelial cells to KS in gene expression profile.

(A) Genes listed in KS signature were picked from uninfected and KSHV-infected MSC, LEC and BEC, and shown by heatmap. RNA-seq Data of KSHV-PDLSC and PDLSC were normalized with the Microarray data of MSC (31). Unsupervised clustering of samples (X-axis) and genes (Y-axis) were performed by average linkage method. (B) Linkage distance between KS and each cell group was determined by Pearson correlation coefficient. (C) First two principal components of these data were identified and shown in multipledimensional scaling (MDS) plot. (D) DEGs from KSHV-infected MSCs and ECs are compared with KS signature with venny diagram. (E) The genes that are consistently regulated in KS and KSHV-infected MSCs or ECs were assorted according to their functions, and compared respectively. “NS”, no significance. “*”, p<0.05.
