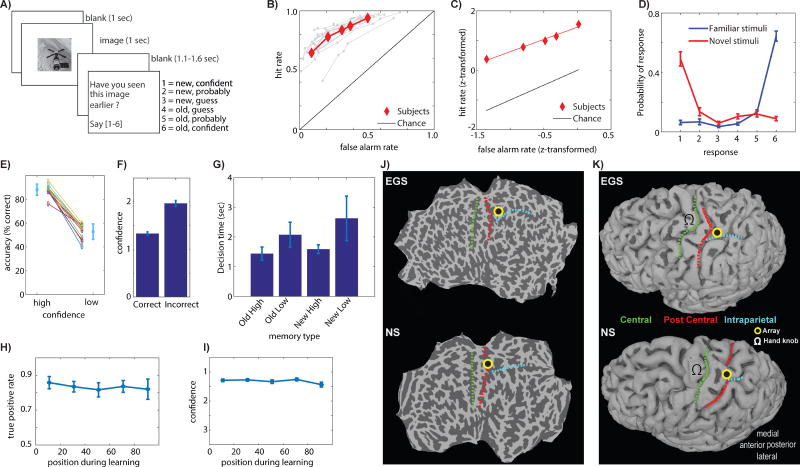
Figure 1. Task, behavior and electrode location.
(A) Task. (B) Behavioral ROC curves for each session (grey) and average (red). (C) z-transformed average ROC curve. (D) Probability of response as a function of ground truth (color). (E) Retrieval accuracy as a function of confidence. (F) Average confidence was higher for correct vs. incorrect responses. (G) Decision time varied as a function of both familiarity (new/old) and confidence. (H-I) True positive rate (H) and confidence (I) of responses to old stimuli during recognition was independent of serial position during learning. (J-K) Location of recording array, illustrated using flatmaps (J) and reconstructed grey matter surfaces (K). Anatomical landmarks indicated are central sulcus (green), postcentral sulcus (red), and the intraparietal sulcus (cyan).

