Figure 1.
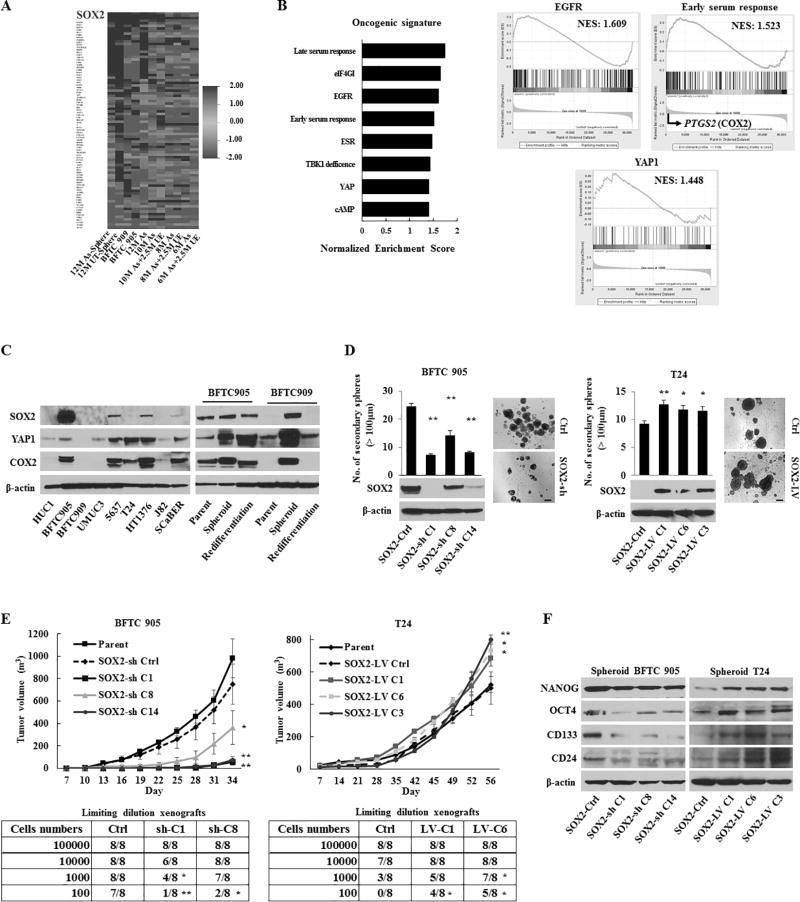
The role of SOX2 in urothelial CSC generation and maintenance. (A) Heat map of the relative expression using a stem cell-specific RT-PCR array in UCB cells (BFTC 905 and BFTC 909) and HUC1 cells exposed at different periods to arsenic (As cells) compared with parental HUC1 cells and the corresponding passage-matched unexposed HUC1 (UE) cells, respectively. 12M-, 10M-, 8M-, and 6M-As cells, HUC1 cells exposed chronically to arsenic for 12, 10, 8, and 6 months, respectively; 10M As+2.5M UE cells, 10M As-cells cultured for 2.5 months without arsenic to determine the arsenic withdrawal effect. (B) Gene set enrichment analysis (GSEA) related to the oncogenic signatures of BFTC 905 cells and As-cells compared with UE-cells. Left, enhanced oncogenic pathways determined by a normalized enrichment score (NES); Right, the enrichment of EGFR, YAP1, and the early serum response (ESR) gene signature. PTGS2 (encoding COX2) was the top rank of metric scores within the leading edge in the ESR signature. (C) Expression levels of SOX2, YAP1, and COX2 in parental and spheroid UCB cells measured by western blotting. (D) Number of the secondary spheres over 100 µm (left upper), representative images of sphere formation (right; scale bars, 200 µm), and western blotting of the SOX2 expression (left lower) in stable SOX2 knockdown (SOX2-sh) or SOX2 induction (SOX2-LV) cells. (E) In vivo tumorigenicity of stable BFTC 905 SOX2-sh cells (left) and T24 SOX2-LV cells (right). Upper, tumor growth curve after xenotransplantation (four mice per group); Lower, tumor initiation frequency of serially diluted BFTC 905 spheroid cells and T24 cells. (F) Expression levels of NANOG, OCT4, CD133, and CD24 in BFTC905 SOX2-sh and T24 SOX2-LV spheroid cells measured by western blotting.
Error bars indicate mean ± SEM. *, P <0.05; **, P <0.01 (Wilcoxon–Mann–Whitney test [D and upper of E], Fisher’s exact test [lower of E]). See also Fig. S1–S3.

