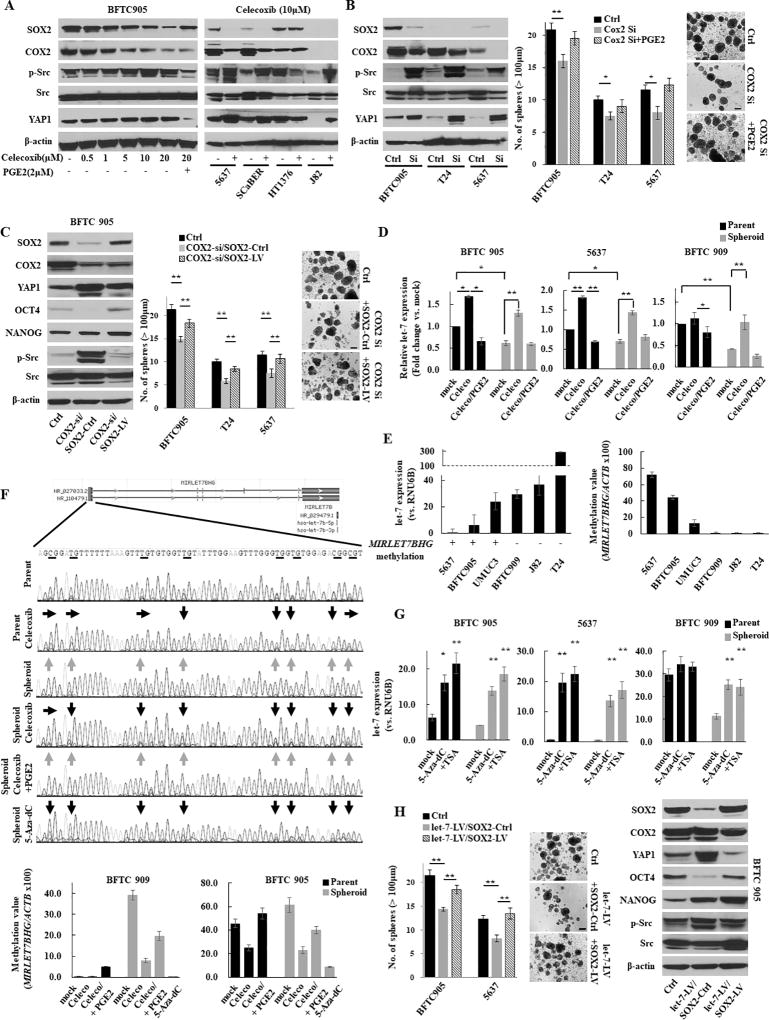
Figure 2.
The COX2/PGE2-let-7-SOX2 signaling axis in urothelial CSCs. (A) Left, western blotting after celecoxib treatment for 72 h ± PGE2 for the last 24 h in BFTC 905 cells. Right, western blotting after treatment with 10 µM of celecoxib for 72 h in UCB cells. (B) Left, western blot of indicated molecules after blockade of COX2 by siRNA; Middle, sphere formation assay; Right, representative images of sphere formation (scale bars, 200 µm). Data are from three independent experiments. (C) Western blotting analysis (left), sphere formation assay (middle), and representative images of sphere formation (right) after COX2 knockdown in SOX2-LV or SOX2-Ctrl (COX2-si/SOX2-Ctrl and COX2-si/SOX2-LV) cells. (D) Expression level of let-7 in several parental or spheroid UCB cells. Expression levels of let-7 after treatment with 10 µM of celecoxib for 72 h ± 2 µM of PGE2 for 24 h were measured by Q-RT-PCR. (E) The expression level of let-7 and the methylation status of the let-7 host gene MIRLET7BHG promoter determined by bisulfite sequencing (left) and Q-MSP (right). The relative level of methylated DNA for MIRLET7BHG gene in each sample was determined as a ratio of the Q-MSP value of the amplified gene to ACTB gene, multiplied by 100. An inverse relationship between promoter methylation of the let-7 host gene and the let-7 expression was observed. (F) The methylation status of the MIIRLET7BHG promoter after treatment with 10 µM of celecoxib, 2 µM of PGE2, or 5 µM of 5-Aza-dC for 5 days in BFTC 909 cells. Upper, schematic diagram of CpG islands (red square) in the 5’-flanking region of the MIRLET7BHG promoter; Middle, chromatogram of the methylation status in the dinucleotide CpG within the promoter region determined by bisulfite sequencing. Gray and black arrows indicate methylated and demethylated dinucleotide CpGs within the promoter region, respectively. Lower, Q-MSP analysis. (G) Reactivation of let-7 after treatment with 5-Aza-dC ± Trichostatin A (TSA). The 5-Aza-dC led to the restoration of the let-7 expression. In addition, combined treatment with 5-Aza-dC and TSA upregulated the expression greater than treatment with 5-Aza-dC alone, indicating histone deacetylation may also be included in the regulatory mechanism. (H) Sphere formation assay (left), representative images of sphere formation (middle), and western blotting (right) after the dual induction of let-7-LV and SOX2-LV (let-7-LV/SOX2-LV).
Each error bar indicates mean ± SEM. *, P <0.05; **, P <0.01 (Wilcoxon–Mann–Whitney test [G] and Kruskal–Wallis with post-hoc test [B, C, D, and H]). See also Fig. S4.

