
Figure 2.
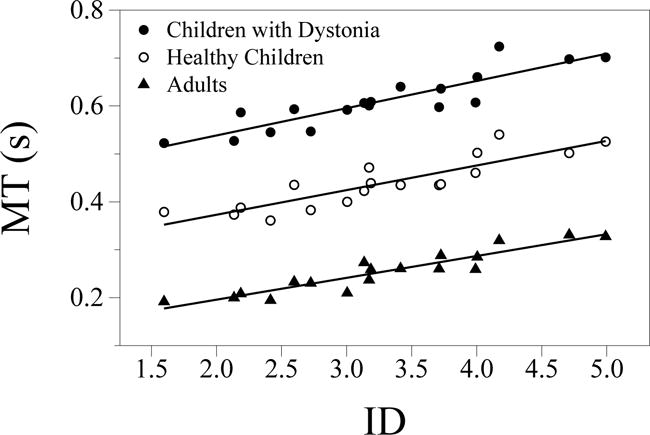
Mean movement time (MT) for all subjects as a function of the index of difficulty (ID). The straight lines show the best fits by the least squares method for each group (● - Children with dystonia, ○ - Healthy Children and ▲ - Adults).
Official websites use .gov
A
.gov website belongs to an official
government organization in the United States.
Secure .gov websites use HTTPS
A lock (
) or https:// means you've safely
connected to the .gov website. Share sensitive
information only on official, secure websites.
Mean movement time (MT) for all subjects as a function of the index of difficulty (ID). The straight lines show the best fits by the least squares method for each group (● - Children with dystonia, ○ - Healthy Children and ▲ - Adults).