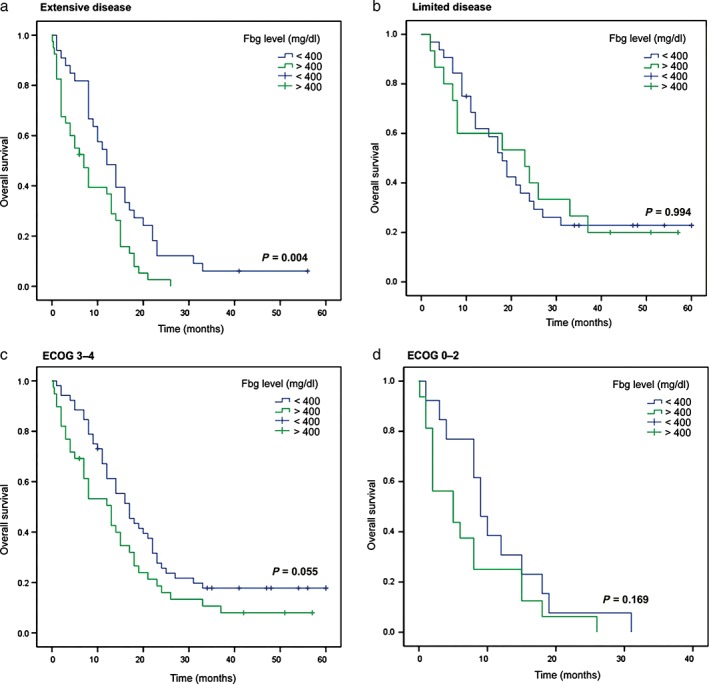
Figure 2.

Kaplan–Meier curves of overall survival stratified by fibrinogen level. (a) Extensive disease (P = 0.004), (b) limited disease (P = 0.994), (c) Eastern Cooperative Oncology Group (ECOG) grade 3–4 (P = 0.055), and (d) ECOG grade 0–2 (P = 0.169) subgroups.
