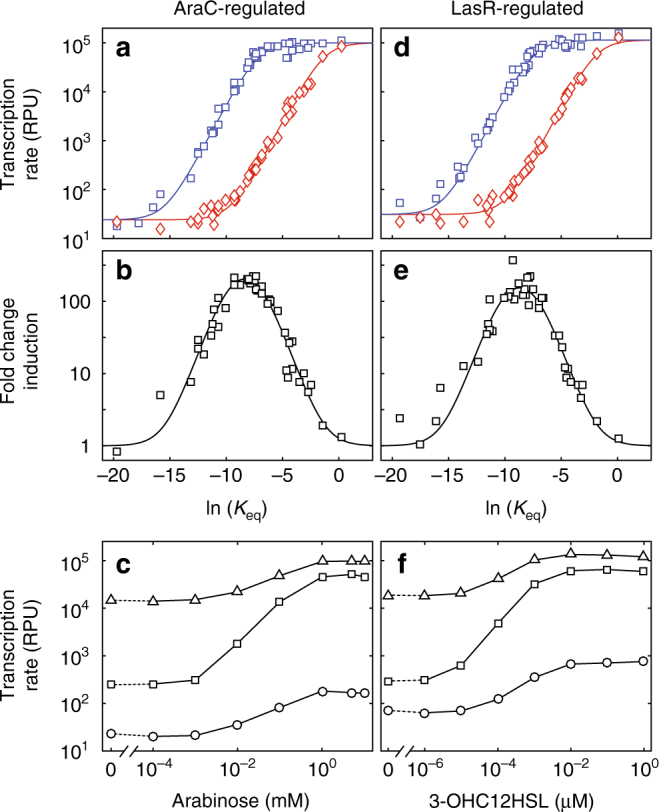
Fig. 3.

A thermodynamic model of promoter affinity fits the data. a Experimentally measured transcription rates of the AraC-regulated promoter as a function of the relative equilibrium constant of σ-factor binding to the −10 and −35 sites for both induced (blue squares) and uninduced (red diamonds) conditions. The thermodynamic model (solid curves) was fit to the results of each combination of the −10 and −35 sites. b The fold-change induction (ratio of the induced and uninduced transcription rates) of the AraC-regulated promoters as a function of relative equilibrium constant of σ-factor binding to the −10 and −35 sites. c Transcription rate as a function of arabinose concentration for three AraC-regulated promoters: Para-bD (circles), Para-dE (squares), and Para-eG (triangles). d Experimentally measured transcription rates of the LasR-regulated promoter as a function of the relative equilibrium constant of σ-factor binding to the −10 and −35 sites for both induced (blue squares) and uninduced (red diamonds) conditions. The thermodynamic model (solid curves) was fit to the results of each combination of the −10 and −35 sites. e The fold-change induction (ratio of the induced and uninduced transcription rates) of the LasR-regulated promoters as a function of relative equilibrium constant of σ-factor binding to the −10 and −35 sites. f Transcription rate as a function of 3OH-C12-HSL concentration for three LasR-regulated promoters: Plas-bD (circles), Plas-dE (squares), and Plas-eG (triangles). Experiments were performed with biological triplicates. Error bars in each plot have been omitted for clarity as they are, in most cases, smaller than the size of the symbols. Thermodynamic modeling data and experimental data are available in Supplementary Information and Supplementary Data 4, respectively
