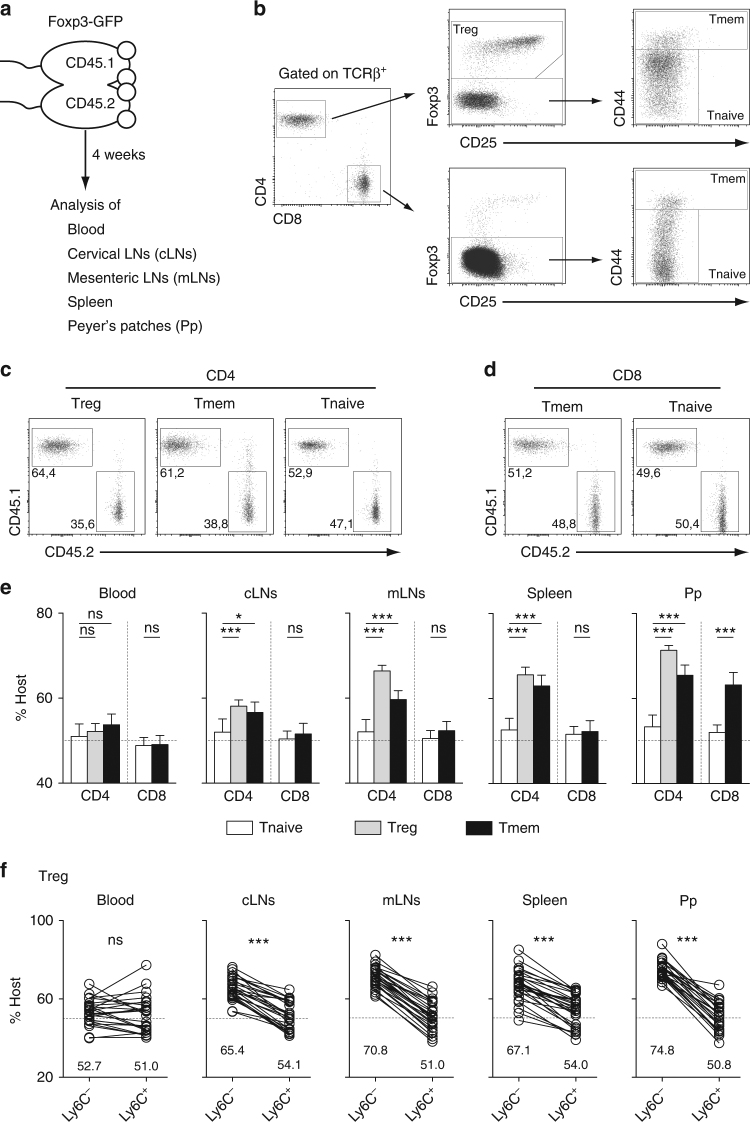
Fig. 1.
Analysis of mouse parabionts reveals the long-term residence of T cell populations in SLOs. Four weeks after parabiosis surgery, blood, cervical LNs (cLNs), mesenteric LNs (mLNs), spleen, and Peyer’s patches (Pp) were recovered and analyzed. a Diagram illustrating the experimental model. b Gating strategy to define naïve (Tnaive), memory (Tmem) and regulatory (Treg) CD4 and CD8 T cells. c CD45.1/CD45.2 dot-plots are shown for mLN CD4 Treg, Tmem and Tnaive cells from a representative CD45.1 parabiont. d CD45.1/CD45.2 dot-plots are shown for mLN CD8 Tmem and Tnaive cells from a representative CD45.1 parabiont. e Proportions of host cells (CD45.1+ for the CD45.1 parabiont and CD45.2+ for the CD45.2 parabiont) among the indicated CD4 T cell and CD8 T cell subsets recovered from blood, cLNs, mLNs, Spleen, and Pp are shown for at least ten parabiotic pairs from three independent experiments (mean ± SEM; paired t-test). f Proportions of host cells among Ly-6C− and Ly-6C+ CD4 Treg cells. Each pair of dots represents an individual mouse (paired t-test). *p < 0.05, ***p < 0.001. ns not significant

