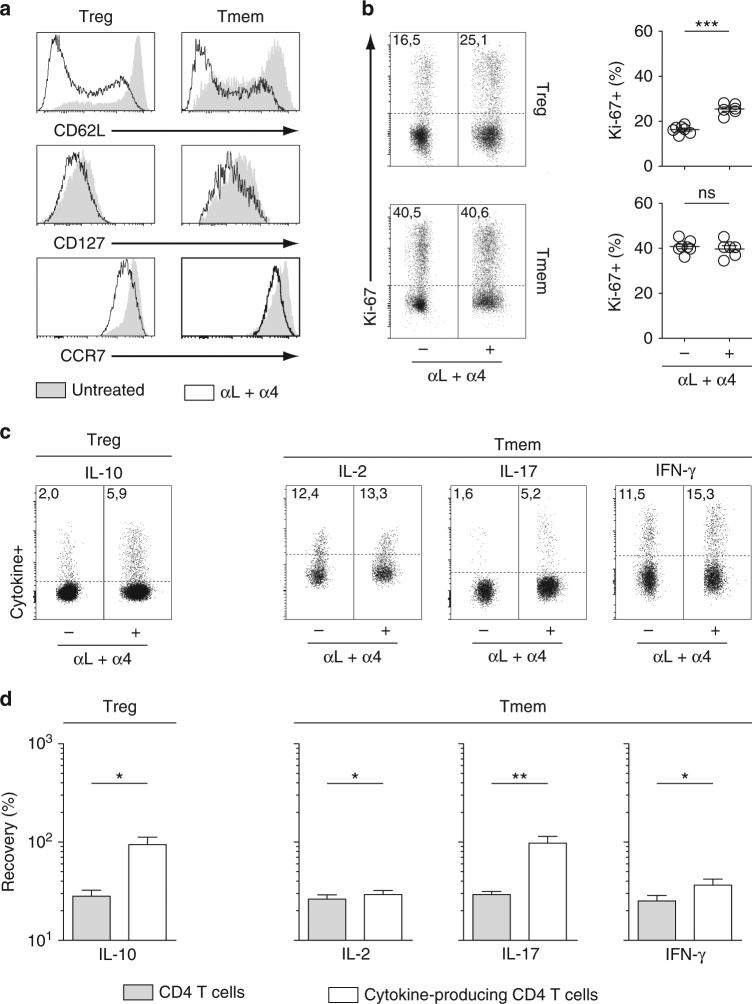
Fig. 4.
pLN-resident CD4 T cells exhibit an effector phenotype. 6–12-week-old C57BL/6 Foxp3-GFP mice were injected or not i.p. with 200 μg of anti-LFA-1 (αL) and anti-VLA-4 (α4) Abs. Forty-eight hours later, pLNs were harvested and analyzed. a CD62L, CD127, and CCR7 fluorescence histograms of CD4 Treg and CD4 Tmem cells from a representative treated and a representative control C57BL/6 Foxp3-GFP mouse. b Representative Ki-67 expression by CD4 Treg and CD4 Tmem cells from treated and control mice. Quantification is shown on the right side of the panel (unpaired t-test). Each dot represents an individual mouse. c Representative IL-10 expression by CD4 Treg cells and representative IL-2, IL-17, and IFN-γ expression by CD4 Tmem cells from treated and control mice. d Quantification of cytokine production by CD4 Treg and Tmem cells is shown as means ± SEM with paired t-test. The percentage of recovery for a given cytokine was calculated by dividing the absolute numbers of cells expressing this cytokine in treated mice by the mean absolute number of cells expressing this same cytokine in untreated animals (white bars). The gray bars correspond to the recovery of total CD4 Treg or CD4 Tmem cells in the same samples. *p < 0.05, **p < 0.01, ***p < 0.001. ns not significant

