
Fig. 2.
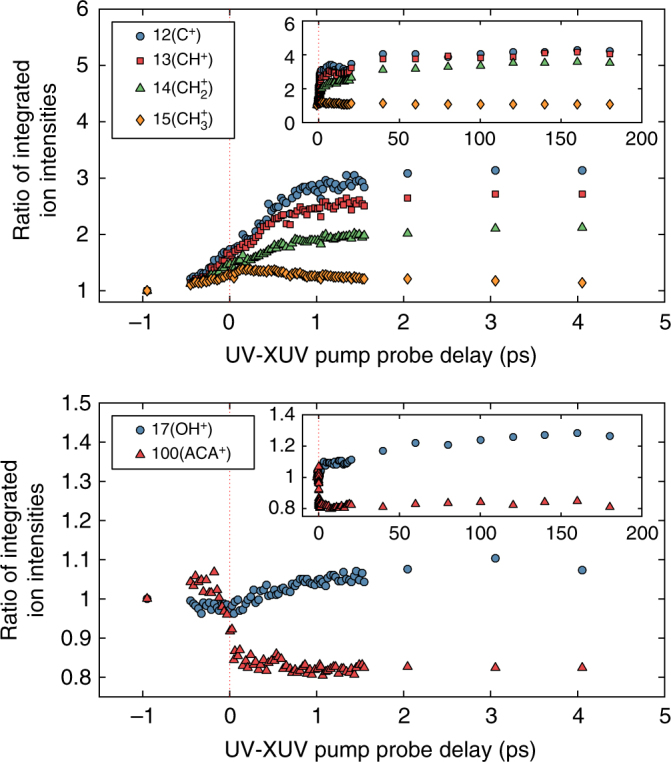
Ratios of integrated ion intensities. Top of panel: ratio of integrated ion intensities at a given delay to the integrated ion intensity at −1 ps (FEL only) for the fragments CHx + in the range 0–5 ps. Inset: same in the enlarged scale 0–200 ps. Bottom of panel: ratio of integrated ion intensities at a given delay to the integrated ion intensity at −1 ps (FEL only) for the fragments OH+ and the parent ion as a function of pump-probe delay in the range 0–5 ps. Inset: same in the extended delay range 0–200 ps