Fig. 3.
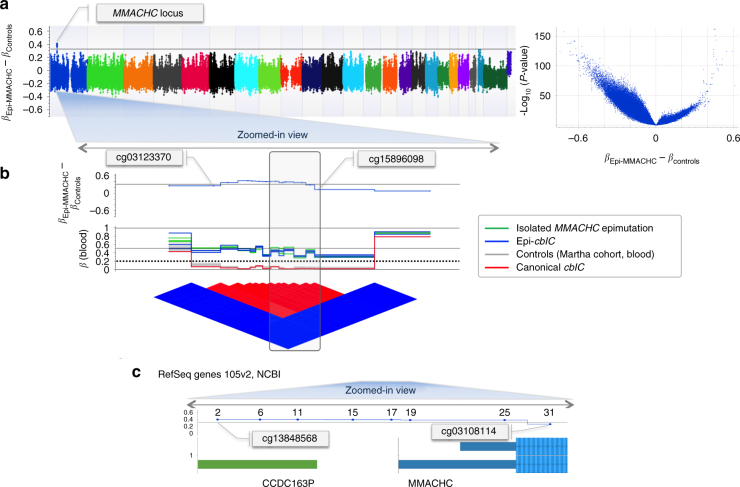
Epigenome-wide analyses confirm the presence of the epimutation in genomic DNA and sperm. a Epi-Manhattan plot for the differences between β values in the epi-MMACHC subjects and controls (βEpi-MMACHC–βControls). The horizontal line indicates a difference of 0.3; the volcano plot shows the relationship between (βEpi-MMACHC–βControls) and −log10 (P-value) for the t-test. b Enlarged view of the MMACHC locus; β values of the CpG probes in the MMACHC locus and the epi-linkage disequilibrium plot reporting the matrix relationship between the CpG probes based on the blood samples. The dotted line corresponds to a β value threshold of 0.2, below which the CpG probe was considered to be fully unmethylated. c Genomic position of the MMACHC locus according to RefSeq Genes 105v2, NCBI (GRCh37)

