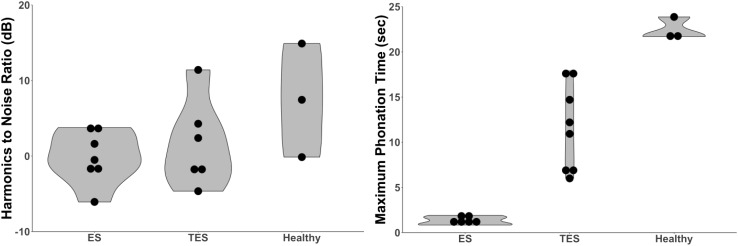
Fig. 3.
Left violin plot displaying the distribution of the mean HNR outcomes in eight studies [27–29, 31, 32, 34, 38, 47]. ES n = 86, TES n = 82, H n = 90. Right violin plot displaying the distribution of the mean MPT outcomes in eight studies [29–31, 34, 36–38, 44]. ES n = 84, TES n = 123, H n = 55. ES esophageal speakers, TES tracheoesophageal speakers, H Healthy speaker, ELS electrolarynx speakers, HNR harmonics to noise ratio, MPT maximum phonation time

