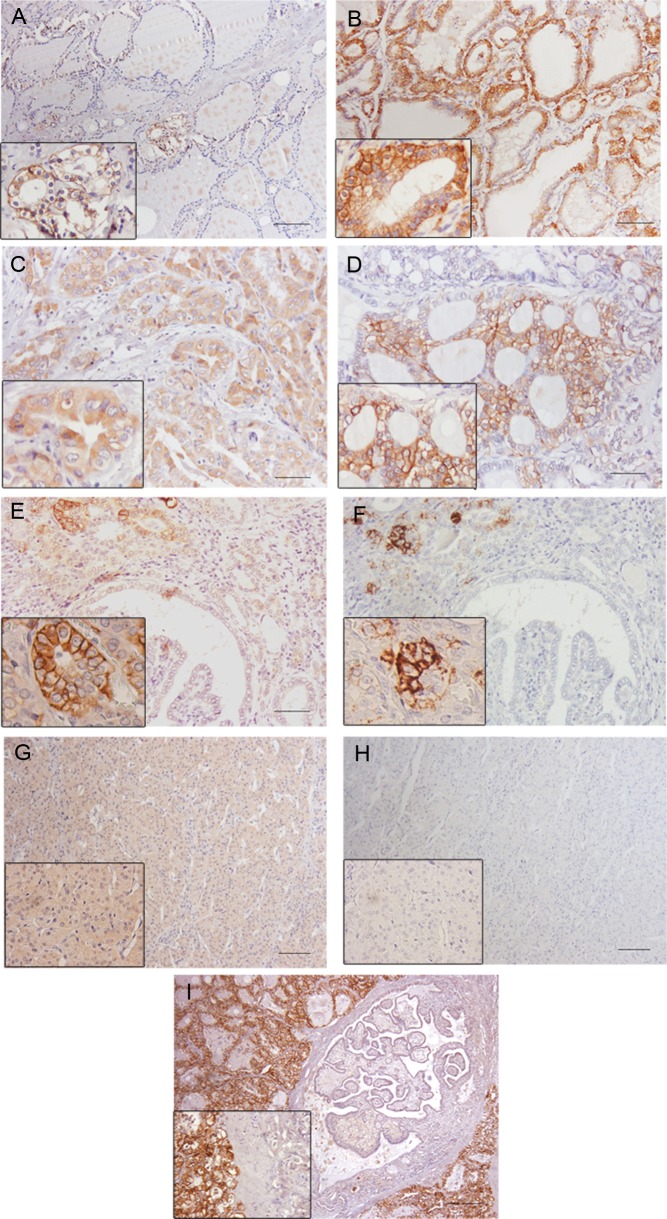
Figure 3.
NIS immunoexpression in different thyroid tissues. (A) Normal thyroid; (B) Graves’ disease; (C) cytoplasmatic staining in an oncocytic PTC; (D) membrane staining in a fvPTC; (E and F) NIS immunoexpression in a fvPTC without and with TSA amplification signal, respectively; (G and H) NIS immunoexpression in a FTC without and with TSA amplification signal, respectively; (I) negative staining in a cPTC and strong membrane staining in the surrounding Graves’ disease. In F and H, notice the loss of cytoplasmatic staining after the use of TSA amplification system. Bar 100 μm.

 This work is licensed under a