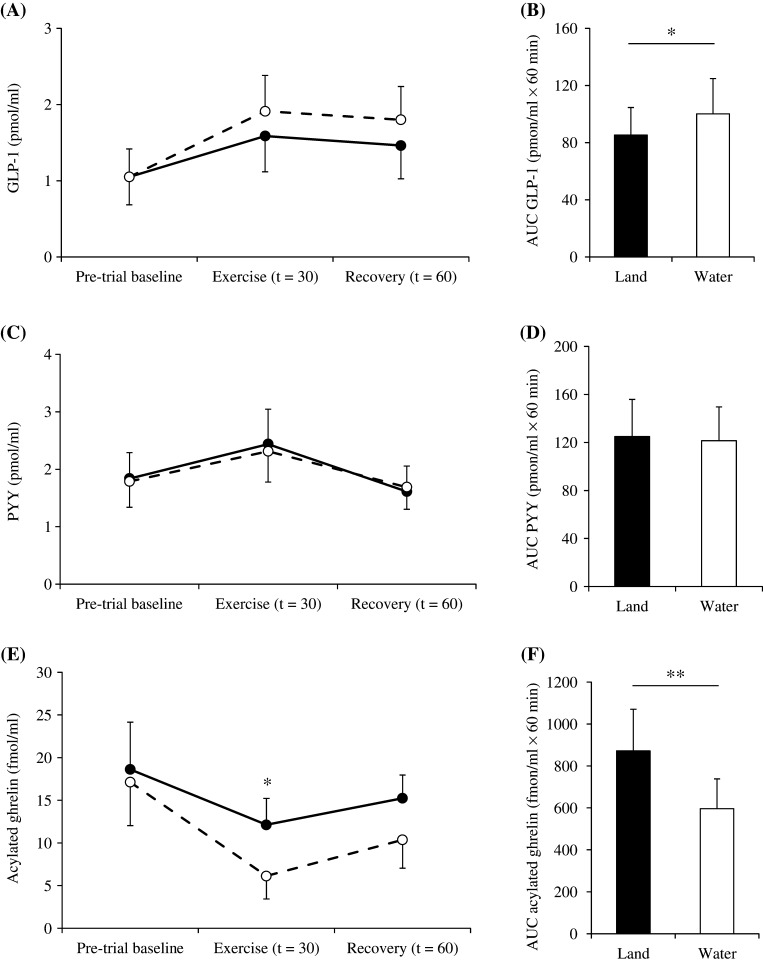
Figure 3.
Differences in plasma GLP-1 (A), PYY (C) and acylated ghrelin (E) concentrations during walking in water (○) and on land (●) trials and area under the curve values for GLP-1 (B), PYY (D) and acylated ghrelin (F). The mean values ± s.d. of each parameter are presented. *P < 0.05, **P < 0.01, water vs land trials.

 This work is licensed under a