Figure 4.

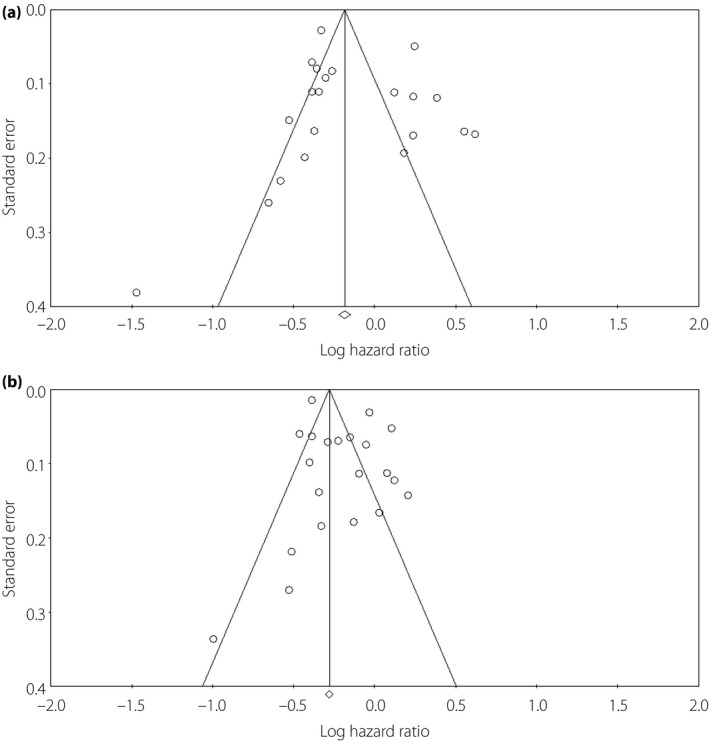
Funnel plot based on log hazard ratio of all‐cause mortality with (a) obese and (b) overweight patients vs normal weight patients. Begg's test: P = 0.88 for obese; Begg's test: P = 0.53 for overweight vs normal weight patients.

Funnel plot based on log hazard ratio of all‐cause mortality with (a) obese and (b) overweight patients vs normal weight patients. Begg's test: P = 0.88 for obese; Begg's test: P = 0.53 for overweight vs normal weight patients.