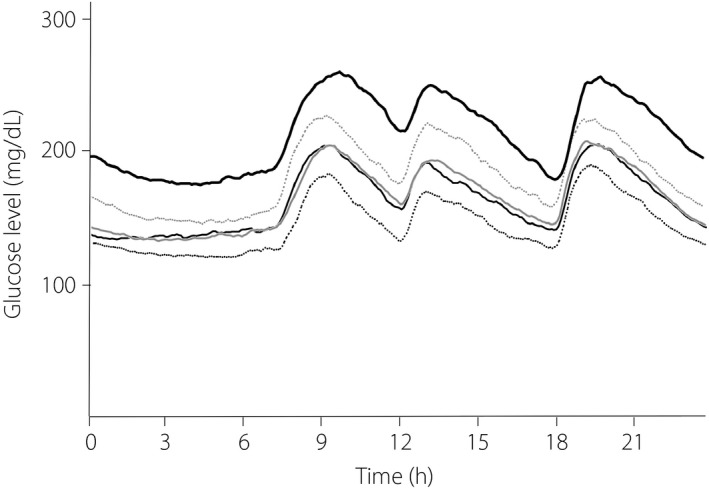
Figure 2.

The 24‐h changes in blood glucose level in type 2 diabetes patients receiving treatment. Black dotted line, glycated hemoglobin (HbA1c): ≥6.0 to <7.0%; black thin line, HbA1c: ≥7.0 to <8.0%; gray line, HbA1c: ≥8.0 to <9.0%; gray dotted line, HbA1c: ≥9.0 to <10.0%; black thick line, HbA1c: ≥10.0%.
