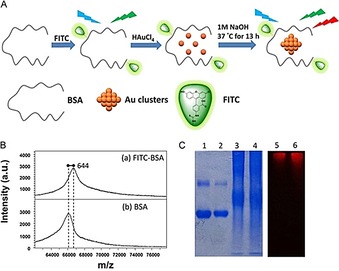
Figure 34.

a) Step‐by‐step illustration of the procedure used to prepare FITC/BSA gold nanoclusters (188). b) MALDI‐TOF mass spectra of a) FITC‐BSA and b) BSA. c) Native‐PAGE image of BSA (lane 1), FITC‐BSA (lane 2), BSA gold nanoclusters (lane 3), and FITC/BSA gold nanoclusters (lane 4) after staining with Coomassie Brilliant Blue. Native‐PAGE image of BSA gold nanoclusters (lane 5) and FITC/BSA gold nanoclusters (lane 6) under λ=488 nm excitation (laser‐based gel scanners) without Coomassie brilliant blue. Reproduced with permission from Ref. 263. Copyright 2015 Elsevier B. V.
