Figure 2.

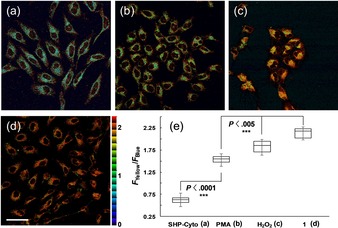
Pseudo‐colored ratiometric TPM images (F yellow/F blue) of Hela cells incubated with 3 μm a) SHP‐Cyto and d) 1. Cells were pretreated with b) PMA (1 μg mL−1) for 30 min and c) 200 μm H2O2 for 30 min. e) Box plot of average F yellow/F blue in (a)–(d). Images were acquired by using 750 nm excitation and fluorescent emission windows: blue 400–470 nm, yellow 530–600 nm. Scale bar=60 μm. Cells shown are representative images from replicate experiments (n=5).
