Figure 4.

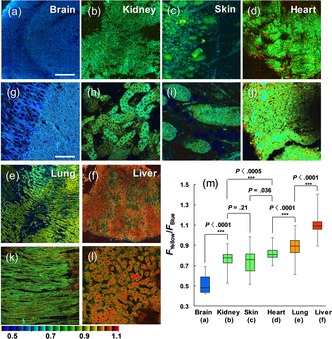
Ratiometric TPM images of the a, g) brain, b, h) kidney, c, i) skin, d, j) heart, e, k) lung, and f, l) liver tissues of rat organs. All tissues were labelled with 20 μm SHP‐Cyto and a–f) 20 ratiometric TPM images were accumulated along the z direction at the depths of approximately 90–180 μm with magnification at 40×. g–l) Enlarged images of (a)–(f) at 120 μm depth. m) Box plot of average F yellow/F blue in (a)–(l). The TPEF were collected at two channels (blue 400–470 nm, yellow 530–600 nm) upon excitation at 750 nm with a femtosecond pulse. Scale bars: 500 μm (a)–(f) and 75 μm (g)–(l).
