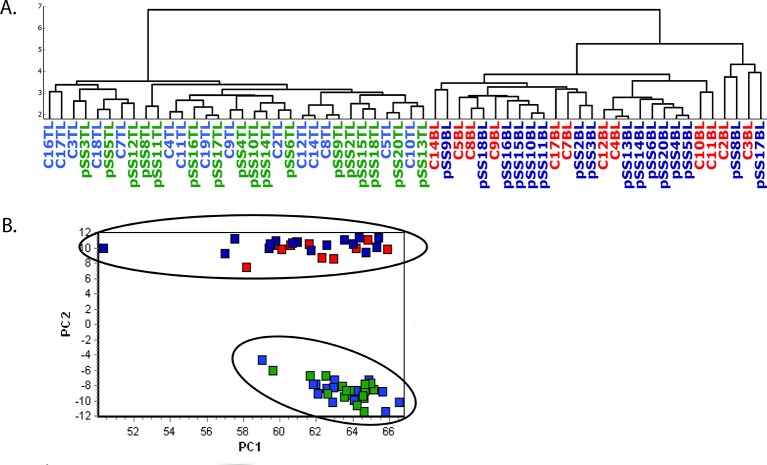
Figure 1.
Hierarchical clustering analysis (A) and principal component analysis (B) of microRNAs detected by quantitative PCR (Cq <37). pSS: patient with primary Sjögren’s syndrome, C: control, TL: CD4+ T lymphocytes, BL: CD19+ B lymphocytes, light blue: control T cells; green: pSS T cells; red: control B cells; dark blue: pSS B cells.

