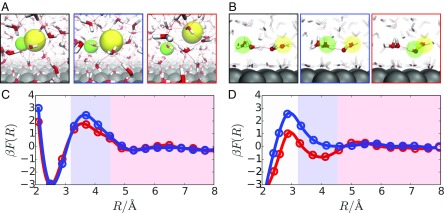
Fig. 1.
A and B contain typical snapshots going from a recombined state (black-bordered panel) to a dissociated state (red-bordered panel) for classical ions and water ions, respectively. The positive ion is highlighted in green, and the negatively charged ion is highlighted in yellow. C and D contain plots of the free-energy profile as a function of , the interionic separation for classical ions and water ions, respectively. The data plotted in red correspond to ions in the bulk, and the data plotted in blue correspond to ions at the electrode interface.

