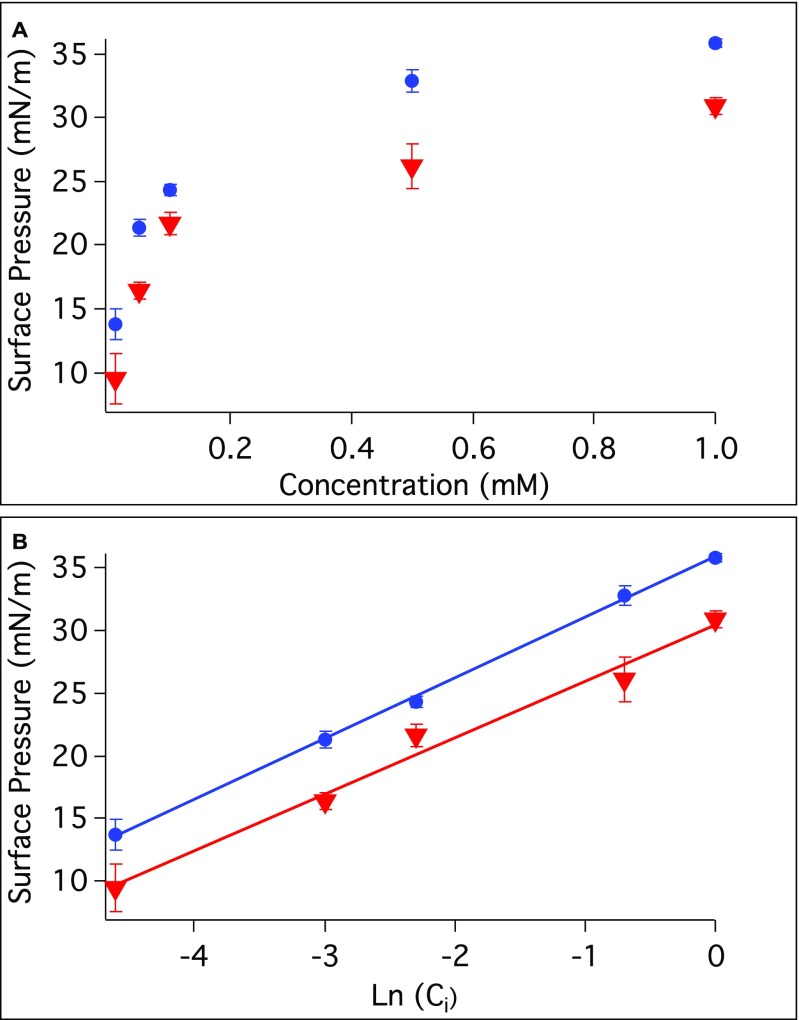
Fig. S1.
(A) A plot of the surface pressure vs. bulk AOT concentration at the CCl4–H2O interface (red) and at the hexadecane–H2O interface (blue) is shown with a sigmoidal dependence. (B) A linear fit of the surface pressure vs. the natural logarithm of AOT concentration for the CCl4–H2O interface (red) and at the hexadecane–H2O interface (blue).

