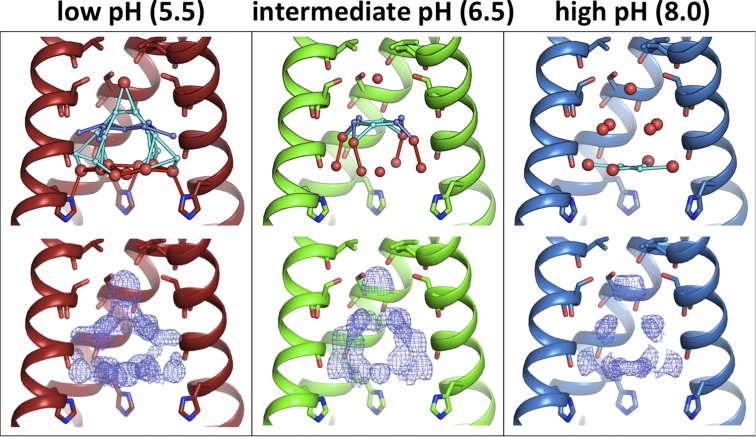
Fig. 4.
Room temperature XFEL structures of M2TM under all pH conditions: low (pH 5.5, 5JOO, red), intermediate (pH 6.5, 5UM1, green), and high (pH 8.0, 5TTC, blue). Waters are shown as spheres (red, full occupancy; light and dark blue, half-occupancy); potential hydrogen bonds are shown as sticks. (Top) The most ordered waters are observed under the low-pH condition, with fewer waters present at intermediate pH and the smallest number of ordered waters at high pH. Moving from low to high pH, the number of half-occupancy waters decreases and the hydrogen-bonding network becomes less complex. (Bottom) Electron density for the pore solvent network (blue mesh) is shown to a contour of 0.5 σ. The same trend is observed from the electron density maps; the largest volume of solvent density is at low pH, and the smallest volume is at high pH.

