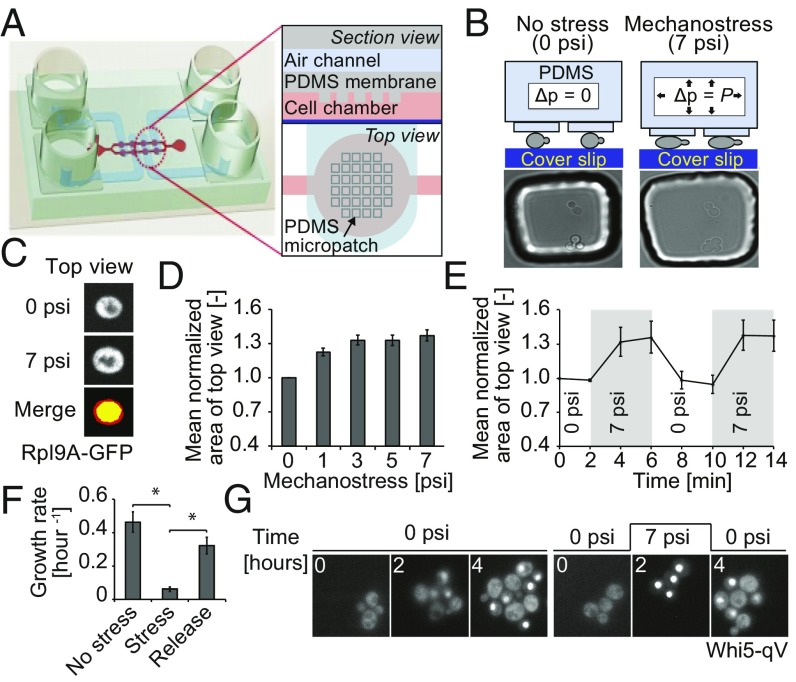
Fig. 1.
A microfluidic device to study mechanotransduction in budding yeast. (A) Schematic representation of the microfluidic device used to trigger mechanostress. The microfluidic chip is made of two layers of soft elastic polymer, PDMS, bonded to glass coverslip on the bottom. See Results and Supporting Information for details. (B) Mechanostress is applied to budding yeast cells trapped in the microfluidic chip coated with concanavalin A. By applying pressure in the air channels, the PDMS micropillars are pushed toward the coverslip, thereby compressing cells trapped below the pillars as illustrated in the schematic drawing. Cells before and after application of mechanostress are shown in microscopy images. (C) Cell perimeter changes as the cell expands in the x and y axes, changing the apparent cell area when cells are viewed from above (top view). Cells expressing Rpl9A-GFP as a cytoplasmic marker were imaged before (0 psi) and after application of 7 psi pressure. Representative images show the top view as maximum intensity projections. The change in cell top view area with mechanostress was measured. Images before (yellow) and after (red) mechnostress were merged to visualize the increase in cell top view area upon mechamostress. (D) The area of cells expressing Rpl9A-GFP was quantified using maximum intensity projections, normalized to the original area, and plotted as a function of pressure applied in the air channel from the digital controller. The error bars indicate the SEM for at least 50 cells analyzed for each condition. (E) The reversibility of the microfluidic device was tested by applying 7 psi at the indicated times, and was quantified every 2 min as the mean area of top view normalized to the original area. See also Movie S1. For each time point, at least 50 cells were analyzed. The SEM is depicted as error bars. (F) The change in cell number was quantified for cells growing for 3 h without stress, after applying mechanostress (7 psi), and 3 h after pressure release. As cells would have overpopulated the cell chamber with 9 h of continuous growth, experiments were performed in two sets. In one set, cells were grown in the chip for 3 h without pressure, and then pressure was applied for another 3 h. In the second set, pressure was applied for first 3 h and then released for another 3 h. The error bars indicate the SE of mean of three experiments. A Student’s t test was performed, and the significances were compared with the mechanostressed condition indicated (*P < 0.05). (G) Mechanostress (7 psi) was applied for 2 h to cells expressing Whi5-qV, and the localization of Whi5-qV was analyzed by fluorescence microscopy at the times indicated. See also Movies S2 and S3. Note that cells exposed to mechanostress arrest with nuclear accumulation of Whi5-qV. Images are taken with objective lens (magnification: B and G, 60×; C, 100×).

