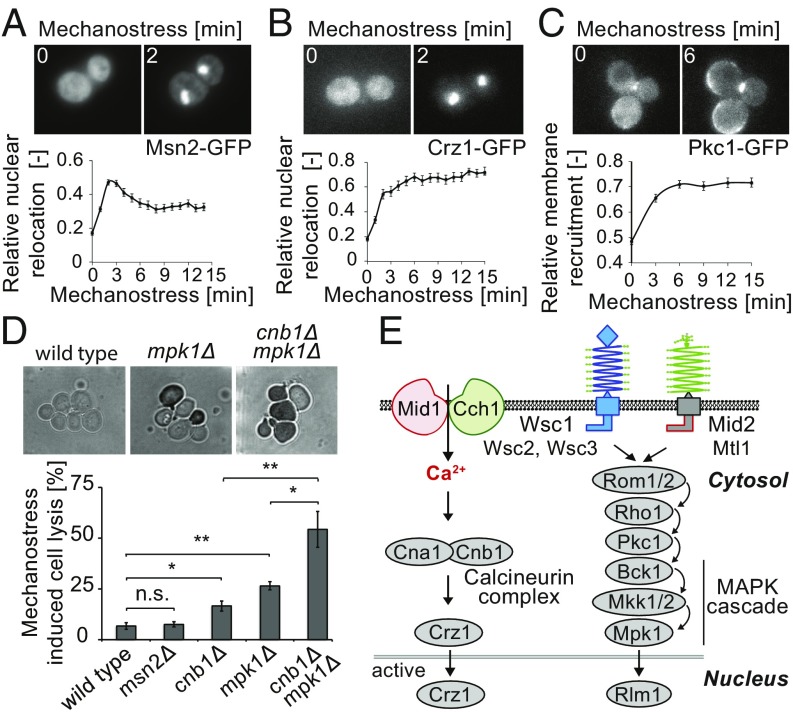
Fig. 2.
Mechanostress sensitive signaling pathways in budding yeast. (A–C) The localization of GFP-tagged (A) Msn2 (Msn2-GFP), (B) Crz1 (Crz1-GFP), and (C) Pkc1 (Pkc1-GFP) was monitored at the times indicated (minutes) after applying pressure (7 psi), and the relative relocalization to the (A and B) nucleus or (C) plasma membrane was quantified (Lower). Maximum intensity projected representative images before and after 2 min of mechanostress are depicted (Upper). The error bars represent SEM for at least 50 cells. (D) Exponentially growing wild-type and the indicated mutant cells were subjected to 3 h of continuous pressure (7 psi), and dead cells were then visualized by 0.025% trypan blue staining. Representative images after trypan blue staining are shown (Upper). The percentage of mechanostressed induced cell lysis was determined after subtracting cell lysis in control cell chambers without pressure (Lower). The error bars indicate SEM from at least three experiments, each with more than 500 cells counted. A Student’s t test was performed, and the statistical significance is indicated [not significant (n.s.) = P > 0.05; *P ≤ 0.05; **P ≤ 0.01]. (E) Schematic representation of the signaling pathways relevant for mechanostress transduction (21, 36). The stretch-activated calcium channel composed of Mid1 and Cch1 allows influx of calcium, thereby activating the calcineurin complex, which, in turn, triggers nuclear translocation of Crz1. The CWI pathway is activated by the putative plasma membrane sensors Mid2, Mtl1, and Wsc1-3, leading to Rho1-dependent membrane recruitment of Pkc1 and, in turn, activation of the Mpk1/Slt2 MAP kinase cascade. The stretch-sensitive extracellular domains of the postulated mechanostress sensors are indicated as springs. Images are taken with objective lens (magnification: A–D, 60×).

