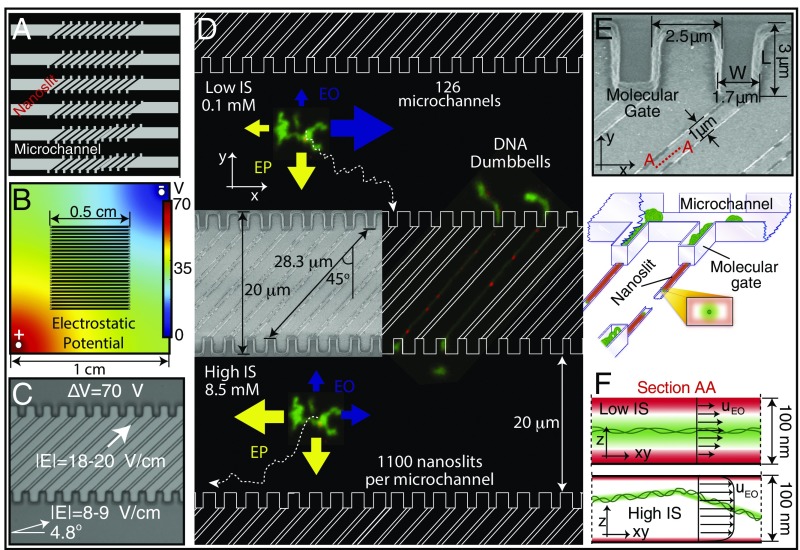
Fig. 1.
Electrostatic confinement and manipulation of DNA: device considerations. (A) Microchannel/nanoslit device schematic (top view): 1.6-μm height × 20-μm width microchannels (molecule bus) connecting 100-nm-high × 1-μm-wide × 28.3-μm-long nanoslits. Entire device, 1.0 cm × 1.0 cm square, comprises 126 microchannels, each one harboring 1,100 nanoslits bounded by molecular gates. (B) Electrostatic potential determined by FE simulation of the entire device within the buffer chamber. Such simulations guided electrode locations for producing the appropriate field lines within the microchannel/nanoslit device. (C) Microchannel/nanoslit device (imaged by DIC microscopy) is superimposed with arrows showing the direction and magnitude of field lines within device microchannel and nanoslit features (70 V applied). (D) Cartoon (top view) shows the direction and magnitude of the electrokinetic forces for low and high ionic strength conditions. (Inset) SEM micrograph (top view) of a patterned silicon master detailing nanoslits and molecular gates. Micrographs of DNA dumbbells bearing nanocoded labels (red punctates) are shown placed within the device. At low I, EO (blue arrows) guides molecules along the microchannel, while EP (yellow arrows) drives them toward the molecular gates. At high I, both directions are dominated by EP. Molecular trajectories (dotted line) are also drawn. (E) SEM of cup-like molecular gate features and dimensions (top view) of a silicon master. Illustration below shows DNA molecules (green) within a microchannel (1.6 μm high). Several molecular gates are shown bearing DNAs threaded into nanoslits (100 nm high), which pass through to the other side to form dumbbells. Note small 1-μm × 100-nm slit openings at the bottom of molecular gates. Cross-sectional view (Inset) depicts intersecting ion distributions (green) surrounding DNA and the nanoslit walls (red). (F) Perspective drawing showing DNA molecules (green balls/threads) within a microchannel. Ion clouds surround DNA and device walls. Lateral cross-sectional view within a nanoslit (see E; view A–A), showing ion clouds, under low and high ionic strength surrounding a DNA molecule (green) and nanoslit (red). At low I, an “electrostatic bottle” is created because ion clouds overlap, electrostatically confining the now-stiffened (increased persistence length) DNA molecule. In contrast, high I engenders a short Debye length, allowing the molecule to more freely diffuse throughout the entire height of the nanoslit. Furthermore, ionic strength conditions collectively affect the profile of the EO flow fields, illustrated by arrows, where the maximum velocity depends directly on the ratio between confinement dimensions and Debye length.

