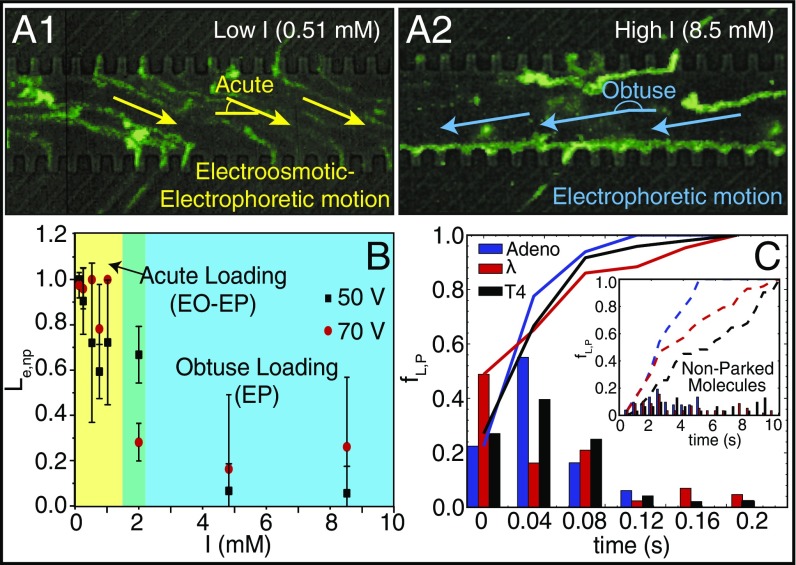
Fig. 2.
DNA parking synchronizes nanoslit loading controlled by ionic strength conditions. (A1 and A2) Green traces show trajectories of adeno DNA molecules traveling through a microchannel, without parking, loading into nanoslits captured by superimposition of 174 image frames (0.03-s interval); device is detailed in Fig. 1. (A1) Yellow arrows indicate overall direction of DNA migration (low ionic strength: 0.51 mM) under EO and EP forces. Accumulation of intense fluorescence along the molecular gate/microchannel interface (A2) indicates lack of passage through nanoslits. (A2) Same conditions as A1, except blue arrows indicate DNA migration dominated by EP forces under high ionic strength (8.5 mM). (B) Plot shows how loading efficiency Le,nP or the yield of adeno DNA molecules as imaged being present at a molecular gate that then goes on to load into nanoslits, without a parking step, varies with ionic strength and applied voltage (square-wave signals: 0 to 70 V, or 0 to 50 V; 0.1 Hz). Error bars are SDs on the means; sample size for the experiments ranged from 18 to 94 molecules. Colors highlight DNA loading regimes: [yellow: acute loading (EO-EP), green: transition, and blue: obtuse (EP)]. (C) Histogram showing the frequency of loading, after parking, fL,P, over time, across three DNA sizes: adeno (35.9 kb), lambda (48.5 kb), and T4 (165.6 kb). (Inset) Loading frequencies fL,nP for molecules without a parking step; lines represent cumulative frequency for each DNA sample (23–67 measurements).

