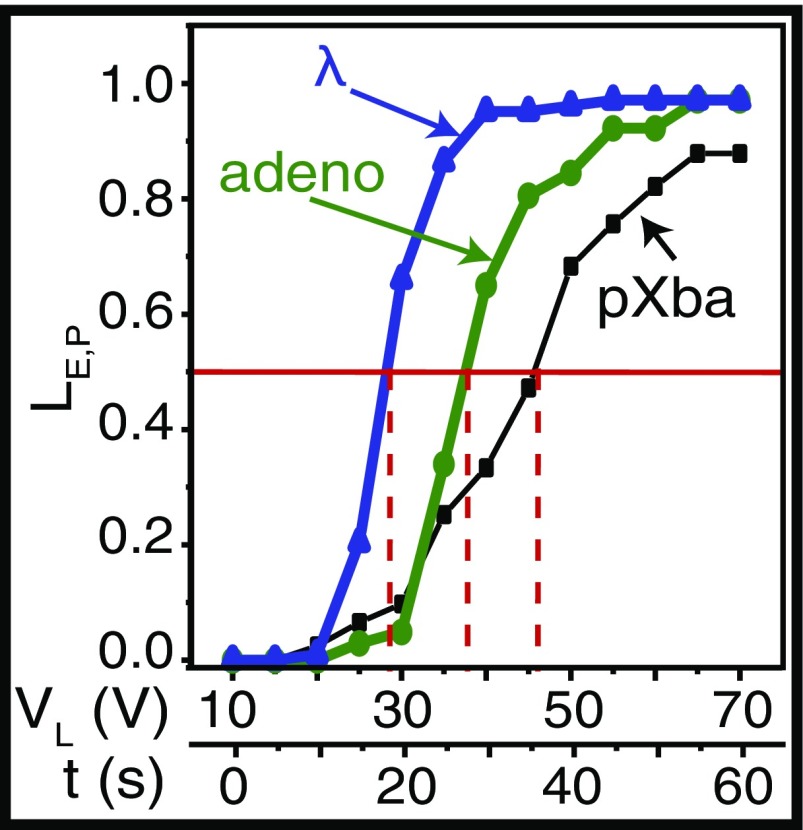
Fig. 4.
DNA loading kinetics, after parking, is governed by size and applied voltage. For each DNA sample, 103–123 molecules were measured and I was fixed at 0.62 mM; molecules were stably parked for 20 s at 10 V before incrementally stepping applied voltage at 5-s intervals, 5 V, from 10 to 70 V (lower x axis). Plot shows LE,P vs. VL(V); VL is the voltage at which 50% of parked molecules are observed loading into nanoslits (horizontal red line); dashed red lines indicate respective VL values at LE,P = 50% for pXba (22.6 kb), adeno (35.9 kb), and lambda (48.5 kb) DNA molecules.

