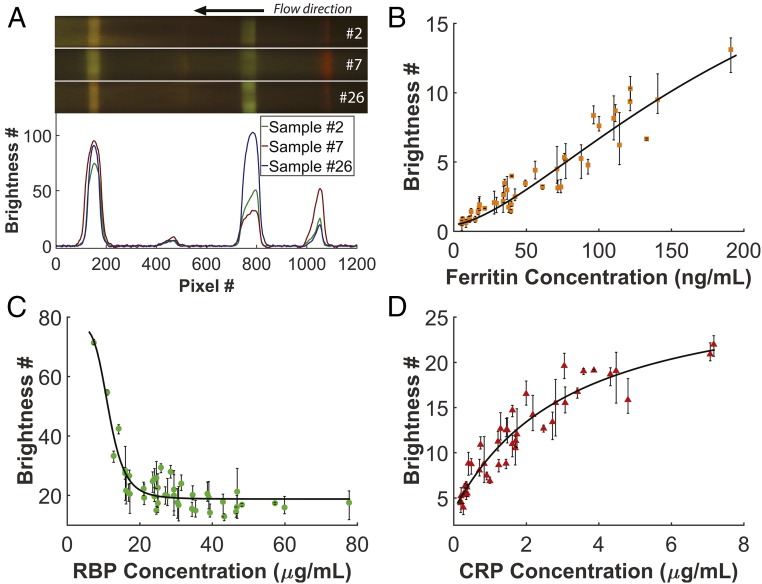
Fig. 3.
Calibration of the biomarkers. (A) Colorimetric variation of the multiplex test strip from three different human serum samples: #2 (with ferritin = 34 ng/mL or 75 pmol/L, RBP = 16.0 μg/mL or 0.76 μmol/L and CRP = 0.37 μg/mL or 15 nmol/L), #7 (with ferritin = 42 ng/mL or 93 pmol/L, RBP = 31.5 μg/mL or 1.48 μmol/L, and CRP = 3.41 μg/mL or 136 nmol/L), and #26 (with ferritin = 40 ng/mL or 89 pmol/L, RBP = 11.0 μg/mL or 0.52 μmol/L, and CRP = 0.27 μg/mL or 11 nmol/L). (B–D) Data points showing the average intensity of the fluorescence signal for each marker at different concentration and calibration of each marker: . Error bars show the range of values obtained from three test strips with the same sample. Values of parameters can be found in Table S1.

