Fig. 2.
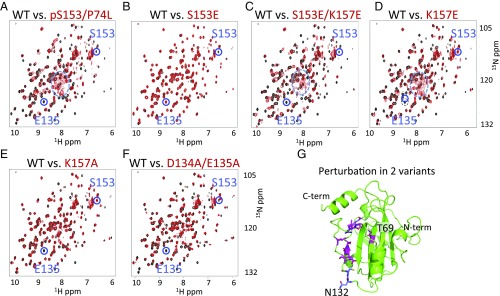
1H-15N HSQC NMR spectra. (A–F) Comparison of WT RKIP (black) to variants (red) indicates that RKIP adopts different conformational states upon S153 phosphorylation or mutation of residues involved in the salt bridge, whereas the phosphomimetic RKIPS153E is insufficient to induce the change. Peaks corresponding to S153 and E135 and the random coil region (dashed circle in A, C, and D) are highlighted. In the variants, the E135 peak is unperturbed only in S153E. Spectra were obtained at 25 °C. (G) Location of residues perturbed in the HSQC spectra of RKIPK157A (magenta) and RKIPD134A,E135A (magenta and blue).

