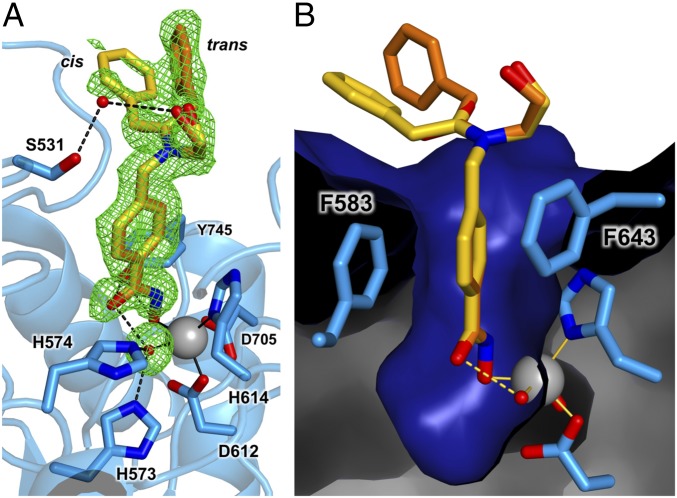
Fig. 1.
(A) Simulated annealing omit map (green, contoured at 2.0σ) for cis (yellow) and trans (orange) conformations of HPB bound to HDAC6. Omit density is also shown for the water molecule (red sphere) bound to the Zn2+ ion (gray sphere). Metal coordination and hydrogen bond interactions are indicated by solid and dashed black lines, respectively. A stereoview appears in Fig. S1. (B) Molecular surface of the HDAC6 active site showing the aromatic ring of the phenylhydroxamate nestled between F583 and F643.

