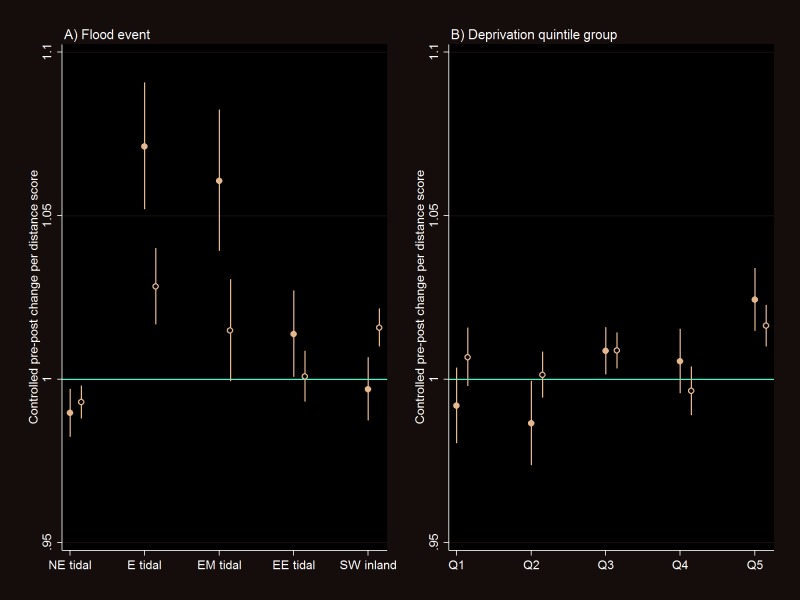
Figure 1.
Controlled preflood and postflood change (interaction rate ratio) in the prescribed antidepressant drugs per distance score (scaled 0 for the furthest and 1 for the nearest distance band) by (A) flood event and (B) socioeconomic deprivation quintile groups (Q1 for the least and Q5 for the most deprived) for the major floods in England, 2011–2014. Filled circle shows that adjusted for year–month and impact of deprivation and population density on change in prescriptions over time and open circle shows that additionally adjusted for the number of non-antidepressant drugs. NE, North East; E, East; EM, East Midland; EE, East of England; SW, South West.

