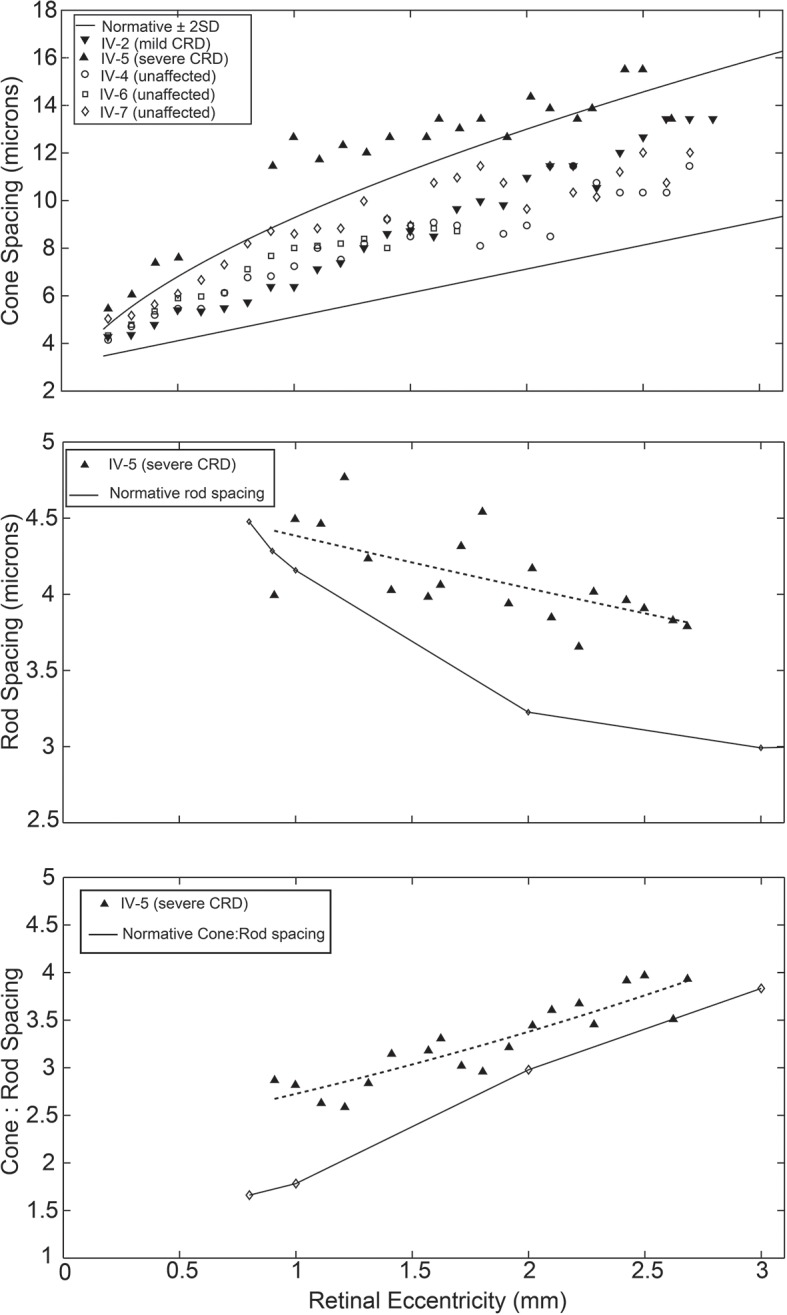
Figure 4.

Photoreceptor spacing. Top: cone spacing of patient IV-2 and unaffected siblings IV-4, IV-6 and IV-7 falls within 2 SDs of mean normative adaptive optics scanning light ophthalmoscope data, indicated by the solid lines. The cone spacing of patient IV- 5 is increased (p=0.001). Middle: rod spacing of patient IV-5 (dashed line, exponential fit curve) is increased compared with histological normative data (p=0.00003), with greater divergence at higher eccentricities. Bottom: The ratio of cone spacing to rod spacing in patient IV-5 (dashed line, exponential fit curve) is increased compared with histological normative data (p=0.00007), indicating that cone loss predominates over rod loss. CRD, cone-rod dystrophy.
