
Figure 2.
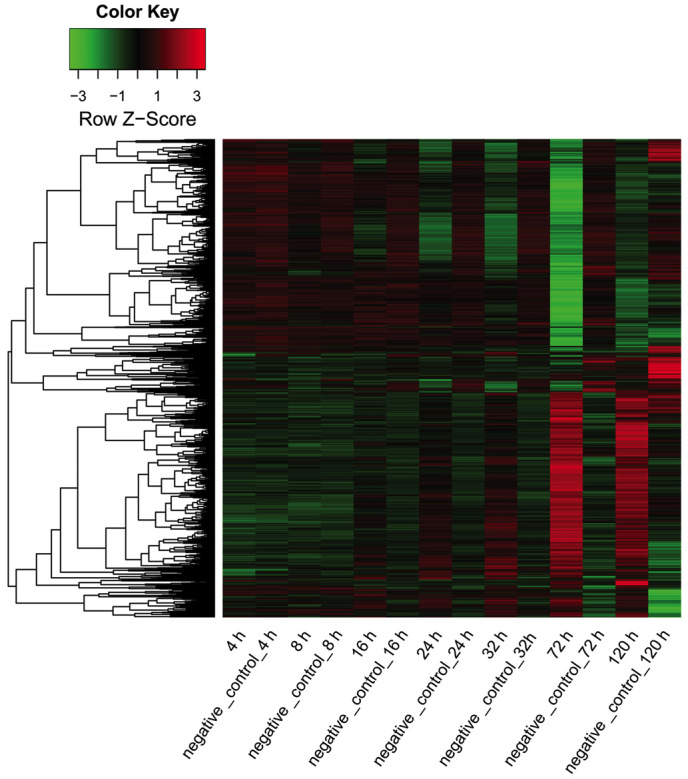
Heat map showing the expression of all differently expressed genes in the microRNA-124 transfection and negative control groups at various time points. Red area, upregulated genes; black area, genes with unaltered expression; green area, downregulated genes.