Figure 1.

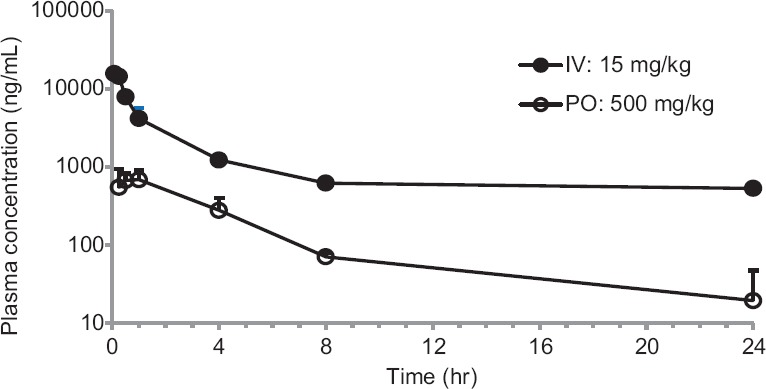
Concentration-time profiles of Paromomycin after intravenous and peroral dose administration to mice. Bars represent the standard deviation (n = 3). The data are expressed as mean ± standard error of the mean

Concentration-time profiles of Paromomycin after intravenous and peroral dose administration to mice. Bars represent the standard deviation (n = 3). The data are expressed as mean ± standard error of the mean