
Fig. 1.
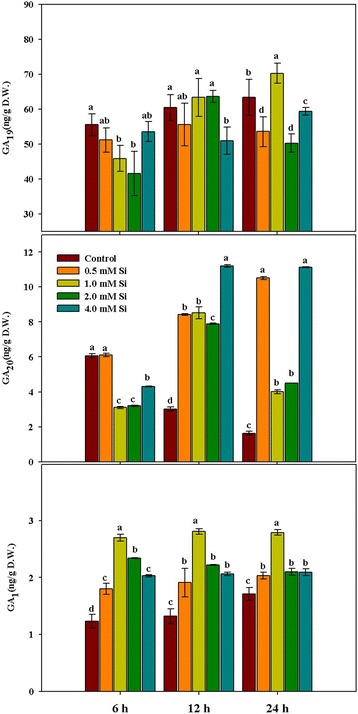
Changes in the levels of gibberellin (GA1) and its precursors (GA19 and GA20) in rice plants in response to different concentrations of Si. The different letter(s) indicates significant differences at P < 0.05 according to Duncan’s multiple range test (DMRT). Each bar shows the standard error of the means of three replications