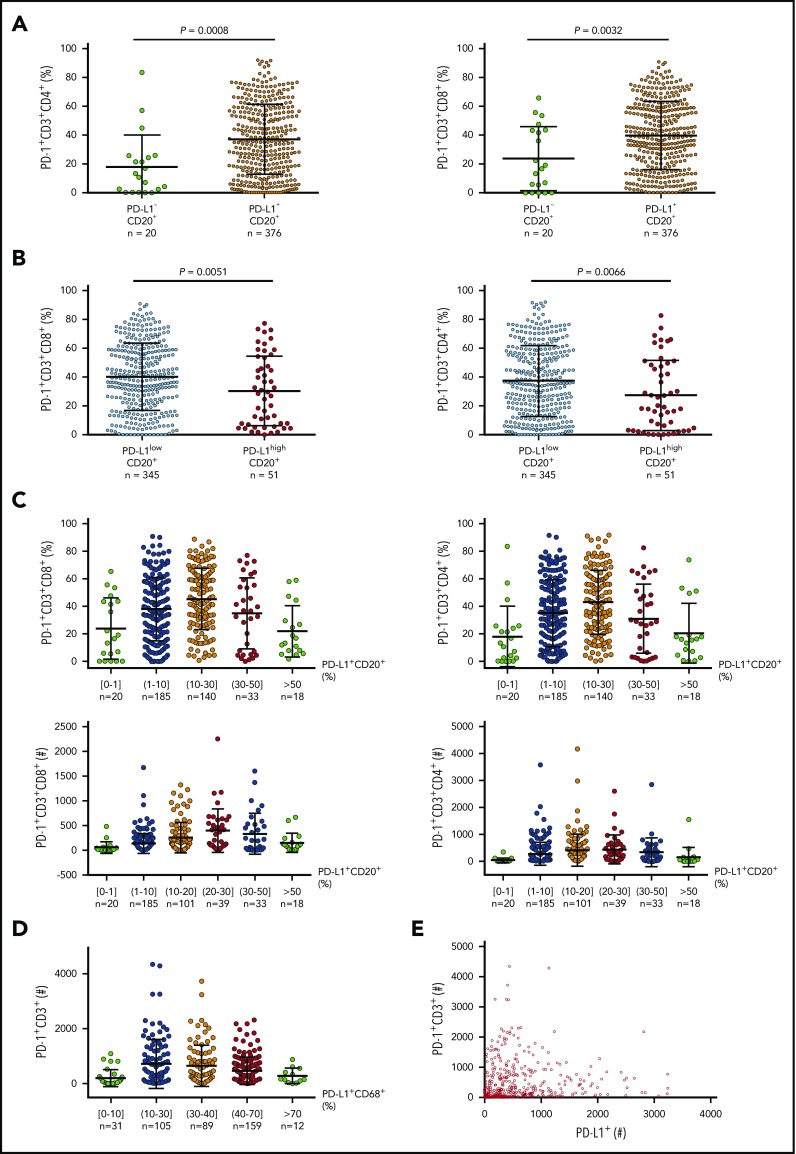
Figure 4.
Correlation between PD-1 and PD-L1 expression in DLBCL. (A) At a low cutoff for PD-L1 positivity on CD20+ lymphoma cells, the PD-L1+ group (95% of the cohort) had a significantly higher mean level of PD-1 expression than the PD-L1– group. (B) At a 30% cutoff for PD-L1high on CD20+ lymphoma cells (according to Kiyasu et al57), the PD-L1high group (12.9% of the cohort) had a significantly lower mean level of PD-1 expression than the PD-L1low group. (C) PD-L1 levels on lymphoma cells were further stratified and correlated to PD-1+ levels (%) and absolute PD-1+ T cell numbers in the tumor microenvironment. (D) PD-L1 levels (%) on CD68+ cells were stratified and correlated to absolute PD-1+ T-cell numbers in the same tissues. (E) Dot plot for total PD-L1+ and PD-1+ cell counts in DLBCL tissues. Each dot represents the data for 1 patient.

