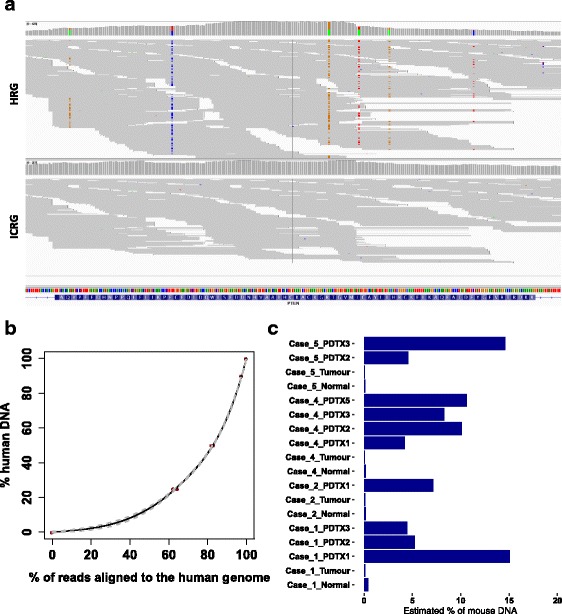
Fig. 1.

Use of the ICRG in WES data. a IGV plot of PTEN exon 5 (WES data from 25% human/75% mouse DNA sample). Top panel: bam files after alignment to the HRG. Bottom panel: bam files after alignment to the ICRG. Mismatching bases are highlighted using the corresponding colour code (A = green, C = blue, G = orange, T = red). b Correlation plot between the percentage of reads mapped to the human genome and percentage of human DNA content in the sample. The solid line shows the calibration curve fitted to the data using penalized regression splines and grey dashed lines show the standard error. c Prediction of mouse DNA content in primary human and PDTX samples using the calibration curve in (b)
