Fig. 2.

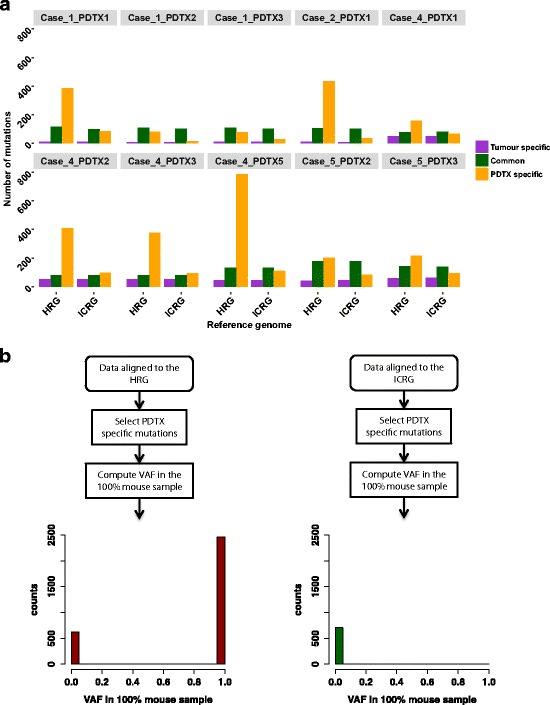
Impact of mouse reads on somatic mutation calling. a Bar plots showing numbers of somatic mutations identified in clinical tumours and matched PDTXs after alignment against either the HRG or the ICRG. Within each pair of clinical tumour and PDTX (n = 10), mutations were classified as ‘tumour specific’ (i.e. present in the tumour but not in the matched PDTX), ‘PDTX specific’ (i.e. present in the PDTX but not in the originating clinical tumour) and common (present in both tumour and PDTX). b Bar plots showing VAFs for all ‘PDTX specific’ mutations identified in the 10 pairs in (a) in the 100% mouse sample. Left panel- data aligned to the HRG; Right panel- data aligned to the ICRG
