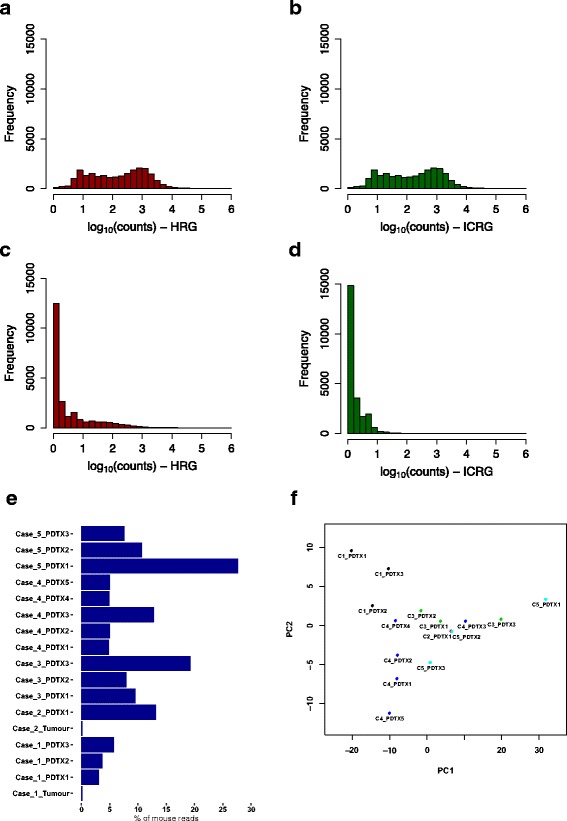
Fig. 3.

Use of the ICRG in RNA-seq data. a-d Bar plots of log10 transformed read counts for 23,059 human genes (having a read count higher than 5 in at least one sample). HRR sample (a-b); MRR sample (c-d). Alignment: HRG (a, c); ICRG (b, d). e Percentage of reads mapped to mouse in the ICRG across samples analysed. f Principle Component Analysis scatter plot using FPKM values of 4275 mouse genes with median FPKM > 1 (15 PDTX samples; 5 models). Different colours represent the distinct 5 PDTX models
