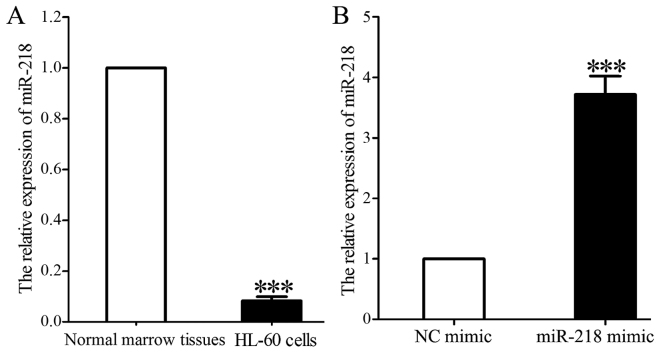
Figure 2.
miR-218 expression is increased in HL-60 cells following transfection with miR-218 mimic. (A) RT-qPCR analysis of miR-218 expression in HL-60 cells compared with normal marrow tissues. (B) RT-qPCR analysis of miR-218 in HL-60 cells following transfection with control or miR-218 mimic. ***P<0.001. miR, microRNA; RT-qPCR, reverse transcription-quantitative polymerase chain reaction; NC, control.

