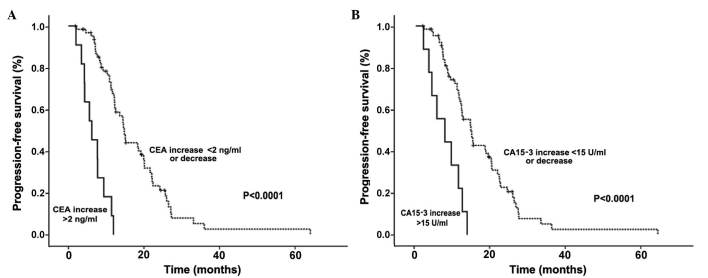
Figure 2.
PFS according to the changes in CEA and CA15-3 levels at the end of the second therapeutic cycle in the 76 patients with non-assessable lesions. Kaplan-Meier graphs indicating the percentage of patients with PFS based on the changes in (A) CEA and (B) CA15-3 levels following the second cycle of chemotherapy. PFS, progression-free survival; CEA, carcinoembryonic antigen; CA15-3, carbohydrate antigen 15-3.

