Fig. 1.

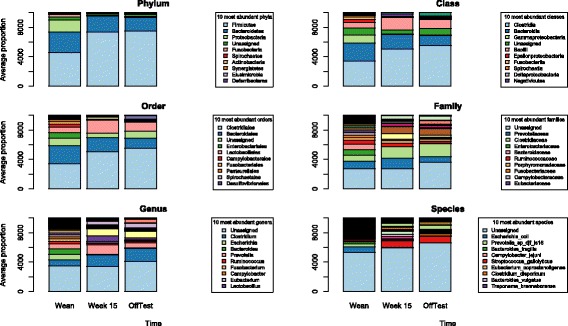
Distribution of abundance of microbiome taxa at various levels over weaning, week 15, and off-test. The y-axis is average proportion of relative abundance. The legend boxes list only the 10 most abundant taxanomic identity at each level

Distribution of abundance of microbiome taxa at various levels over weaning, week 15, and off-test. The y-axis is average proportion of relative abundance. The legend boxes list only the 10 most abundant taxanomic identity at each level