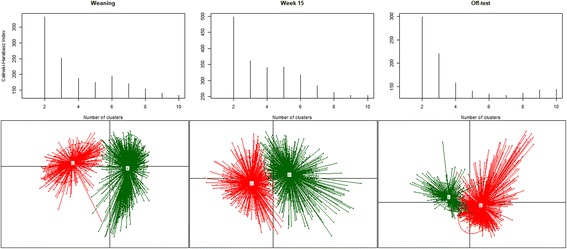
Fig. 3.

Calinski-Harabasz indexes (CH) for number of potential clusters of samples at weaning, week 15, and off-test. The highest CH value at each time point indicates optimal number of cluster/enterotypes. Samples at weaning formed two clusters, A and B. Samples at week 15 formed two clusters, C and D. Samples at off-test formed two clusters, E and F
