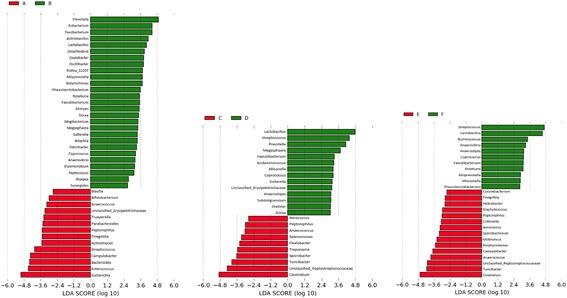
Fig. 4.

Effect size of genera that separate two enterotypes at weaning (A and B), week 15 (C and D), and off-test (E and F). The bar length represents a log10-transformed linear discriminant score. The colors represent which enterotype a genus is found to be more abundant compared to the other enterotype. Only absolute values of the effect size are considered when comparing one genus to another
