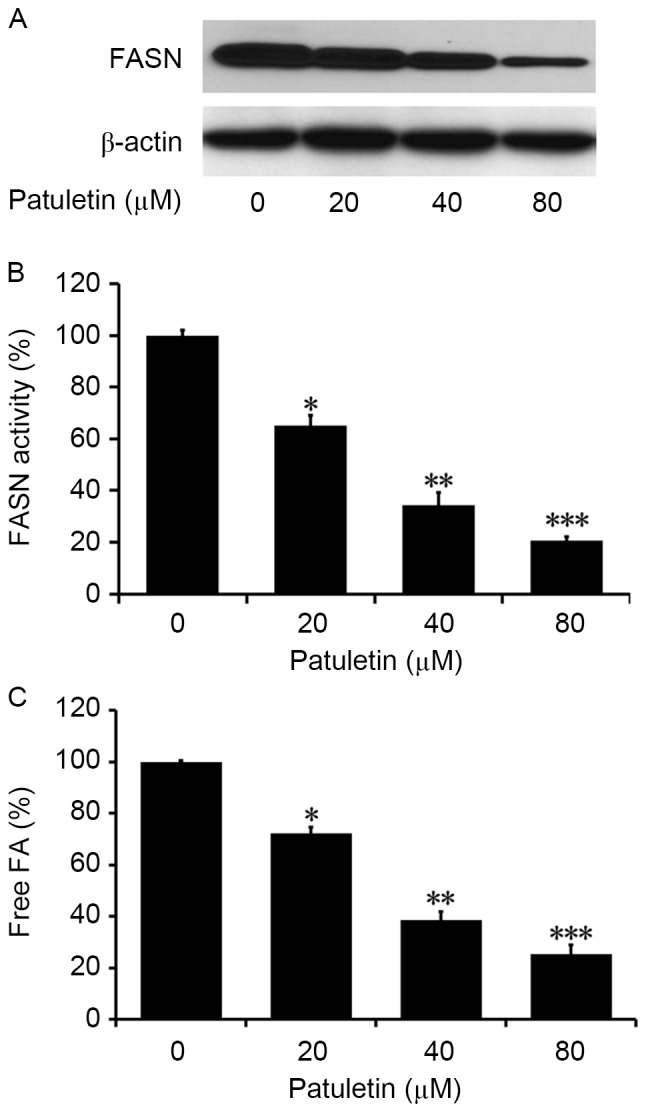
Figure 3.

Inhibitory effects of patuletin on intracellular FASN expression and activity. SK-BR-3 cells were treated with 20, 40 and 80 µM patuletin for 24 h, and then analyzed by different methods. Data were normalized to control cells without patuletin (0 µM). (A) Effect of patuletin on FASN protein expression analyzed by western blotting. (B) Intracellular FASN activity assay. Relative FASN activity was presented as means ± SD. *P<0.05 vs. with 0 µM patuletin-treated group; **P<0.01 vs.0 µM patuletin-treated group; ***P<0.001 vs. 0 µM patuletin-treated group. (C) The amount of intracellular FA was measured by Fatty Acid Assay kit. Data was presented as means ± SD. (n=3). *P<0.05 vs. 0 µM patuletin-treated group; **P<0.01 vs. 0 µM patuletin-treated group; ***P<0.001 vs. 0 µM patuletin-treated group. FASN, fatty acid synthase; SD, standard deviation; FA, fatty acid.
